See who your ads reached
Break ad reach down by region, city, age group and gender, and switch between a chart and a table.
The Audience page under Ad platforms shows who your ads reached, as the ad platforms report it: by region, city, age group and gender. It is about ad reach, not your own users. To send your segments to an ad platform, see Sync segments to ad audiences.
Who can use this. You need Acquisition & Spend, View spend (acquisition:view_spend). Owner, Admin, Marketer and Analyst have it by default. See Roles and permissions.
Before you start
- Turn on spend sync on at least one Google Ads, Meta, Snap Ads or X Ads connection, and wait for its first sync.
- Without that, the page tells you what to do next, for example Turn on spend sync or Waiting for the first sync.
Read the page
- In the sidebar, open Ad platforms, then Audience.
- Under Analyse by, choose Clicks, Impressions or Spend. Every share on the page uses that measure.
- Narrow the data with Connection, Campaign and Dates. Picking a campaign also picks its connection. You can also open this page from the people icon on a campaign row on Campaigns.
- Read the three cards at the top: Top region, Top age group and Gender split.
- Use the tabs Regions, Cities, Age groups and Gender for the full list.
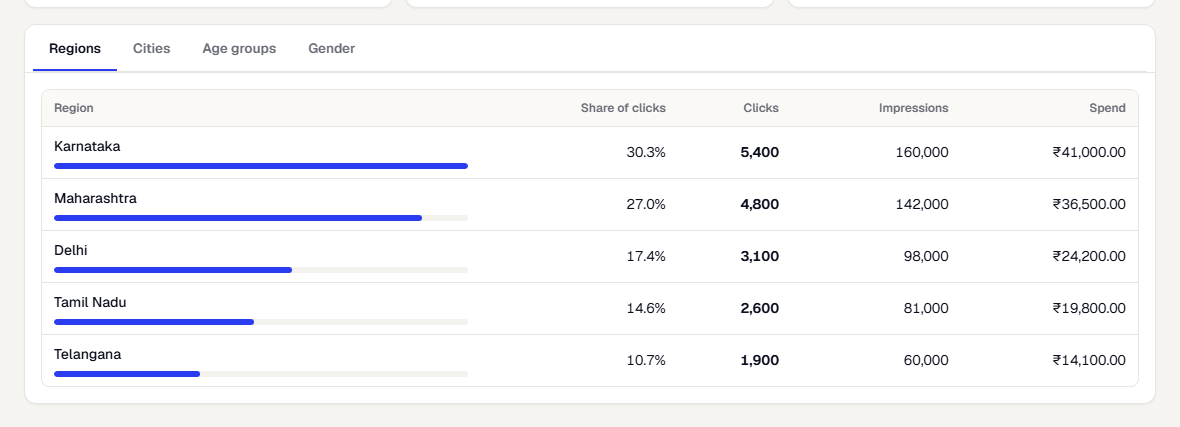
Each tab is a ranked table of Clicks, Impressions and Spend, with a share of the measure you chose and a bar. The column you analyse by is highlighted. Age groups read in age order. Other tabs read biggest first. The list shows 25 rows; select Show all for the rest. On the Gender tab, a bar and legend show the split.
Unknown means the platform could not tell. The top cards skip it unless nothing else is reported.
Currency
If your connections report in more than one currency, spend per row cannot be shown beside clicks. A Currency switch appears when you analyse by Spend, so you read one currency at a time. Clicks and impressions add up across currencies.
Switch between a chart and a table
Where a chart card appears, two small buttons at its top right switch Chart and Table. The table has the same numbers for anyone who prefers to read them or cannot use the chart. It pages ten rows at a time.
What each platform reports
| Regions | Cities | Age groups | Gender | |
|---|---|---|---|---|
| Google Ads | Yes | Yes | Yes | Yes |
| Meta | Yes | No | Yes | Yes |
| Snap Ads | Yes | No | Yes | Yes |
| X Ads | Yes | No | Yes | Yes |
A note on the tab names any platform that does not report that breakdown, for example "Meta does not report city data, so its numbers are not counted here." Its numbers are left out of that tab, so shares on Cities reflect Google Ads only. On the Cities tab, Region narrows the list to cities in one region. Only Google Ads reports a city's region.
If no connected platform can answer a breakdown, the tab says No platform reports it.
What happens next
Was this page helpful?