Read ad spend by campaign
See spend, clicks, results and cost per result for your ad campaigns, filter by platform and dates, and open a trend for any row.
The Campaigns page under Ad platforms shows what your ad platforms say you spent and got back. It covers Google Ads, Meta, Snap Ads and X Ads in one table. The numbers arrive through spend sync, so a platform shows nothing here until you turn that on for its connection.
Who can use this. You need Acquisition & Spend, View spend (acquisition:view_spend). Owner, Admin, Marketer and Analyst have it by default. Without it, the page and the Audience page are hidden from the sidebar. See Roles and permissions.
Before you start
- Connect a platform and turn on Spend sync on its connection. See Pull ad spend into TrueEngage.
- Wait for the first sync to finish. Until then the page says Waiting for the first sync.
Open the page
- In the sidebar, open Ad platforms, then select Campaigns.
- Read the tiles at the top. They total Spend, Impressions, Clicks, CTR, CPC and CPM for everything that matches your filters, not only the rows loaded.
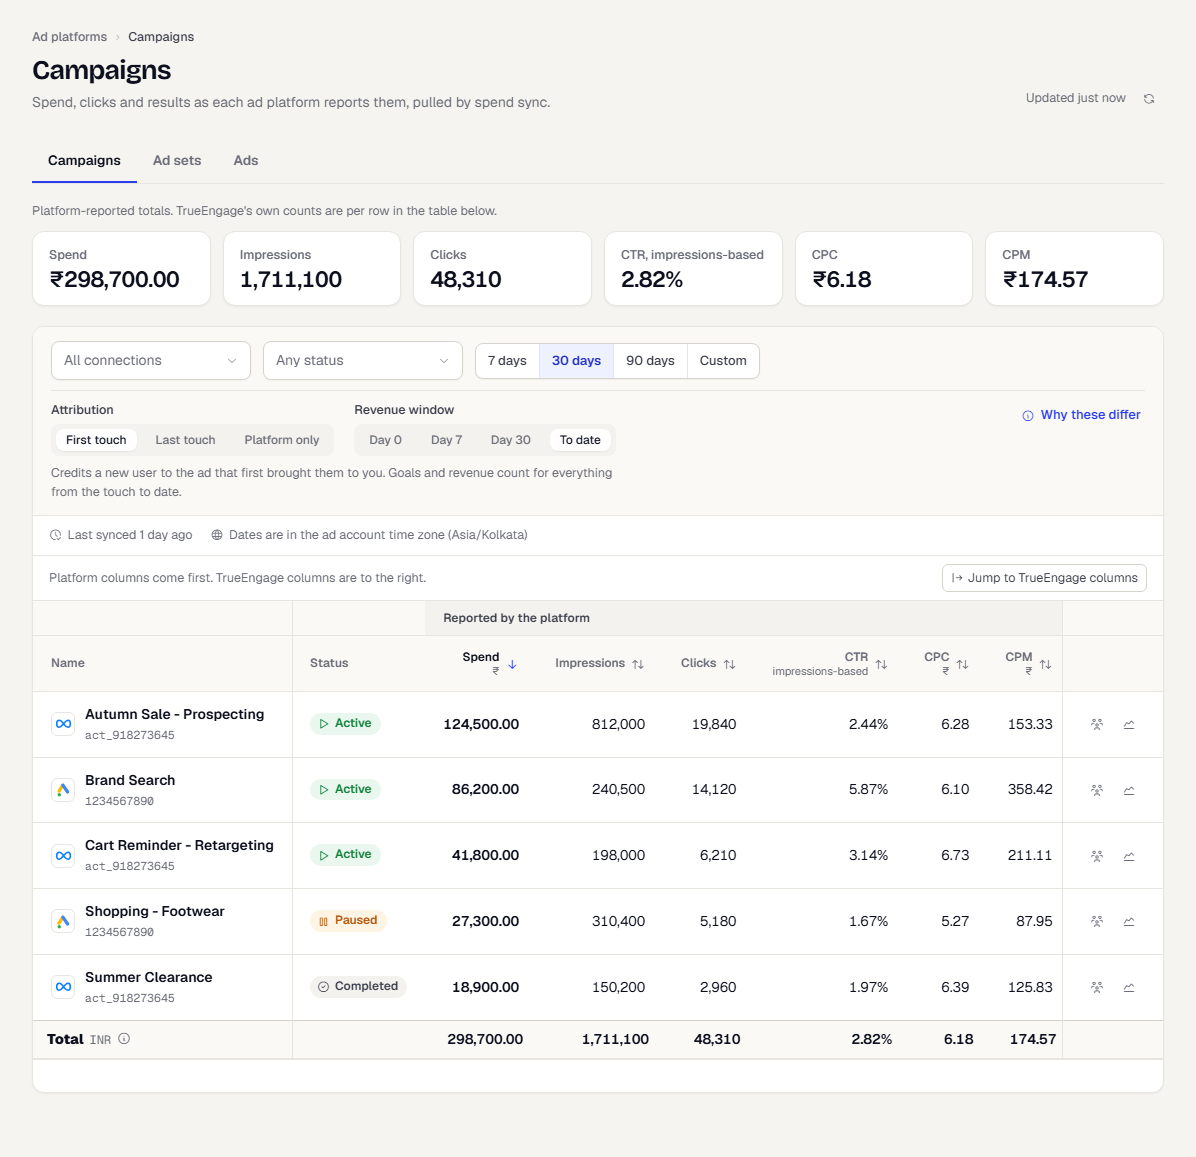
If your accounts report in more than one currency, the page shows one set of tiles per currency and a Total row for each. TrueEngage never adds amounts in different currencies together.
What the columns mean
Every figure in this table is the ad platform's own number.
| Column | Meaning |
|---|---|
| Spend | What the platform charged for the dates you picked, in the ad account's currency |
| Impressions | How many times the ads were shown |
| Clicks | How many times people clicked |
| CTR | Click-through rate: clicks divided by impressions |
| CPC | Cost per click: spend divided by clicks |
| CPM | Cost per thousand impressions |
| Results | The number of times the platform counted your chosen action, such as a purchase or a lead. The action appears under the number |
| Cost per result | Spend divided by results |
A dash means the number cannot be worked out, for example CPC on a row with no clicks. The Results action comes from the Count as a result setting on the connection. Platforms count results with their own tracking, so they will not match the conversions TrueEngage sees.
Filter and sort
- All connections limits the table to one ad platform connection.
- Any status shows only Active, Paused or Completed rows. Hover a status to see the platform's own wording.
- The date range picker sets the dates. Days are cut in the ad account's time zone, which the line above the table names.
- Select a column title to sort by it. Select it again to reverse the order. The table sorts by Spend, highest first, until you change it.
- Clear filters appears when any filter is on. Your filters and sort are in the page address, so you can share the view with a link.
- Load more appears under the table when there are more than 50 rows.
The line above the table shows when the data last synced. If a connection's last sync failed, it says so and links to the connection.
Open the trend for a row
Select the chart icon at the end of a row. A drawer opens with that row's totals and a chart of one measure over time.
- Choose Spend, Impressions, Clicks or Results.
- Choose Daily, Weekly or Monthly.
- Read the table under the chart. It has the same numbers per day, week or month, newest first.
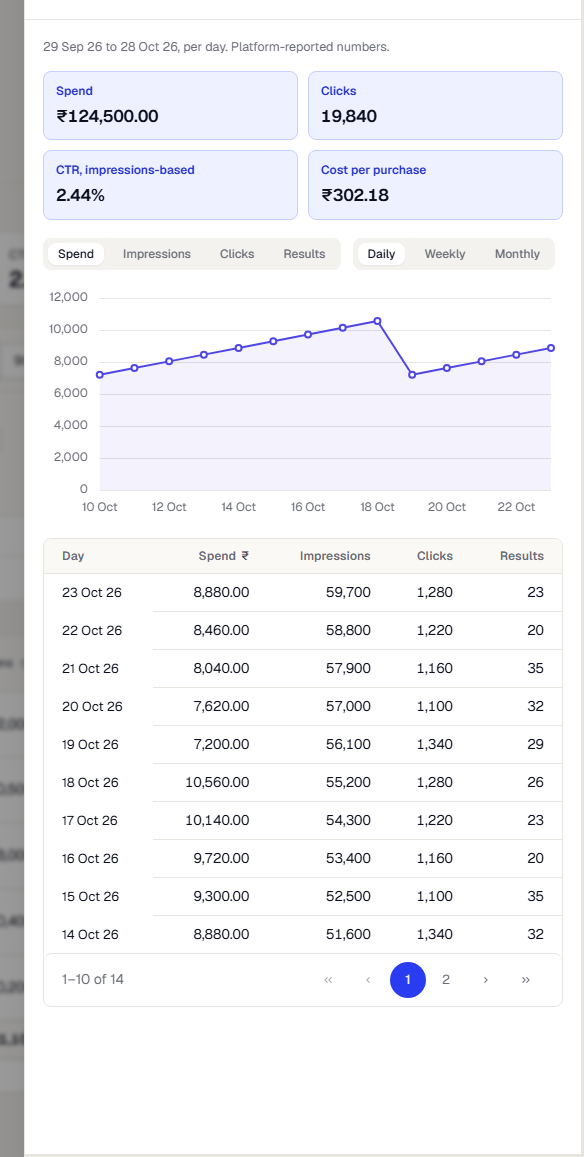
The drawer uses the dates you picked on the page. A day with no data is a gap in the line, not a zero.
See TrueEngage's own counts next to the platform's
Above the table, Attribution chooses what else the table shows:
- Platform only shows just the platform's numbers.
- First touch or Last touch adds a second group of columns, Counted by TrueEngage: New users, Cost per new user, Goal users, Cost per goal, Revenue and ROAS.
- Revenue window sets how long after the first touch goals and revenue still count: Day 0, Day 7, Day 30 or To date.
Select Why these differ to read how the two groups relate. They are different stages counted by different systems, so TrueEngage never adds them together. Select Jump to TrueEngage columns to scroll the table across. ROAS can be blank, and the note under the table says why. Select a number in New users or Goal users to see who is behind it, if your role can view users.
Go further
- Select a campaign name to see its ad sets and ads. See Campaigns, ad sets and ads.
- Select the people icon on a campaign row to see who it reached. See See who your ads reached.
What happens next
Was this page helpful?