Build a funnel
Define a sequence of events, choose how people are counted, and see where they drop off, how long they take and how segments compare.
A funnel counts how many people go through a series of events, such as viewing a product, adding it to the cart and placing an order, and shows where they drop off. Use it to find the weakest step in a journey and to check whether a change helped.
Before you start
- You need permission to view analytics to open funnels and permission to manage analytics to create or edit them.
- The events you want to use must already be flowing from your app or an import. See Data overview.
- To compare against segments or limit the funnel to a group, create the segments first.
Open the funnels list
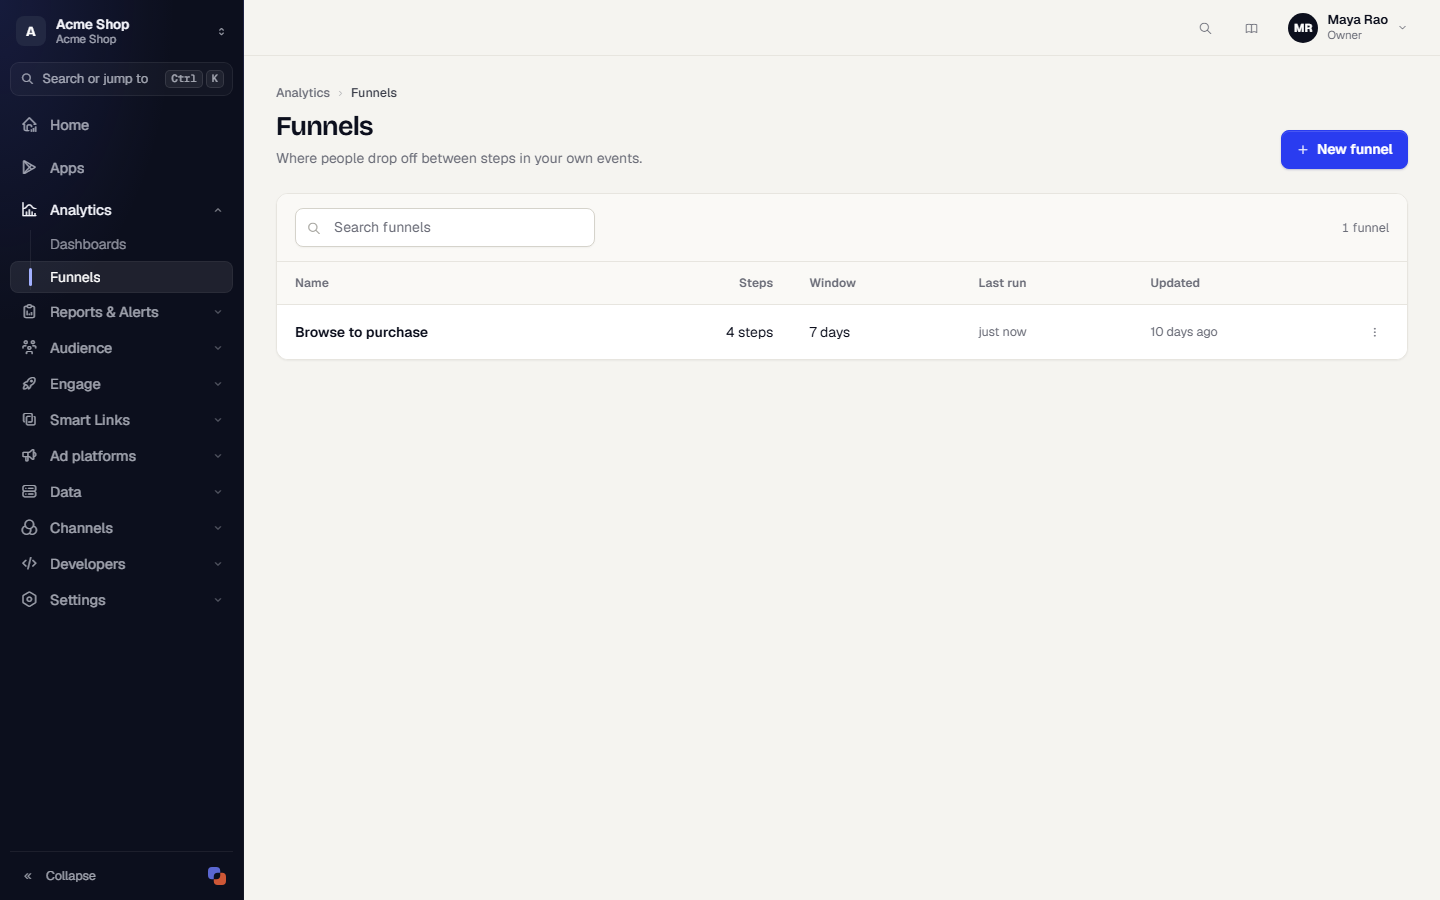
In the sidebar, open Analytics, then Funnels. The list shows each funnel's number of steps, its conversion window, when it last ran and when it was updated. Use Search funnels to find one. Each row's actions menu has Edit, Duplicate and Delete.
Build a funnel
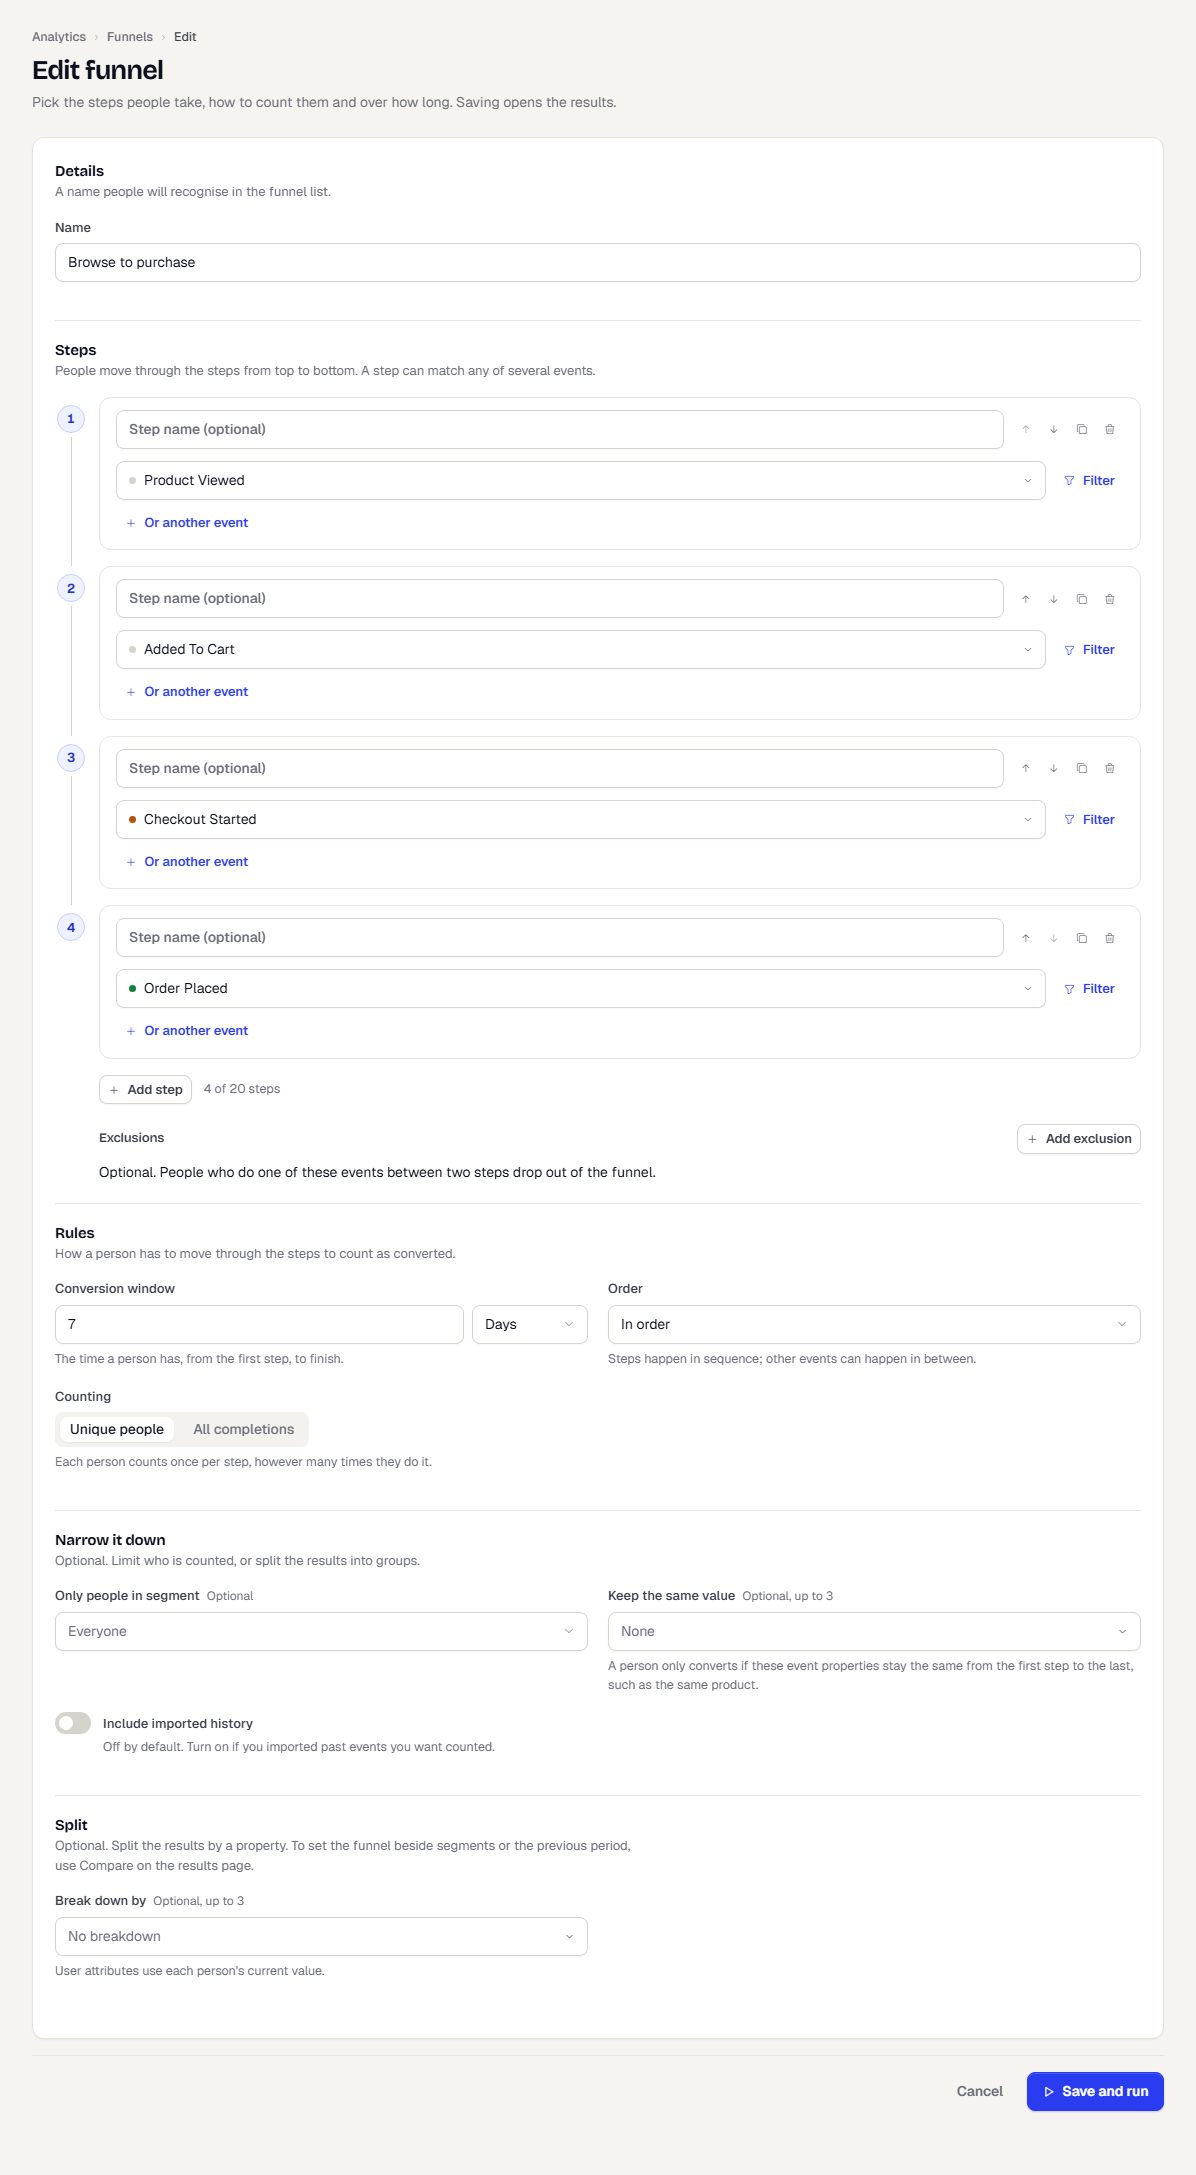
- Click New funnel.
- Under Details, type a Name such as Browse to purchase.
- Under Steps, choose an event for Step 1. Pick the next steps from top to bottom. You can add up to 20 steps with Add step.
- To let a step match any of several events, click the add-event control in the step and pick another. The step then reads event or event. Anyone who does either counts.
- Click Filter on an event to narrow it by an event property, for example only Product Viewed where category is Shoes.
- Give a step a readable name in Step name (optional). Use the arrows to reorder steps and the other buttons to duplicate or remove one.
Choose the rules
Under Rules, decide how a person has to move through the steps to count as converted.
- Conversion window: the time a person has, from the first step, to finish. Enter an amount and a unit. The longest is 90 days. The default is 7 days.
- Order:
- In order: steps happen in sequence, and other events can happen in between.
- Strict order: steps happen in sequence with none of the other steps happening in between.
- Any order: steps can happen in any sequence, as long as all of them happen inside the window.
- Counting:
- Unique people: each person counts once per step, however many times they do it. If they start several times, the best attempt counts.
- All completions: a person who completes the funnel again counts again.
Narrow it down
Under Narrow it down, all fields are optional.
- Only people in segment: count only members of a saved segment. Leave it as Everyone to count all.
- Keep the same value: choose up to three event properties that must stay the same from the first step to the last, such as the same product. A person converts only if they do.
- Include imported history: off by default. Turn it on to count events you imported.
Add exclusions
Under Exclusions, click Add exclusion to drop people who do an event between two steps. For example, exclude Order Cancelled between step 2 and step 3. Click Edit on an exclusion to change the event or the steps it sits between. You can add up to five. Exclusions need In order or Strict order.
Split the results
Under Split, pick up to three properties in Break down by. User attributes use each person's current value. For an event property, choose where it's read from: All steps, First steps or One step, and for the last two which step. The results then show one row per value, and the most common values are listed while the rest are grouped as Other.
Save and run
Click Save and run. TrueEngage saves the funnel and opens its results. Large ranges run in the background and the page updates when they finish.
Read the results
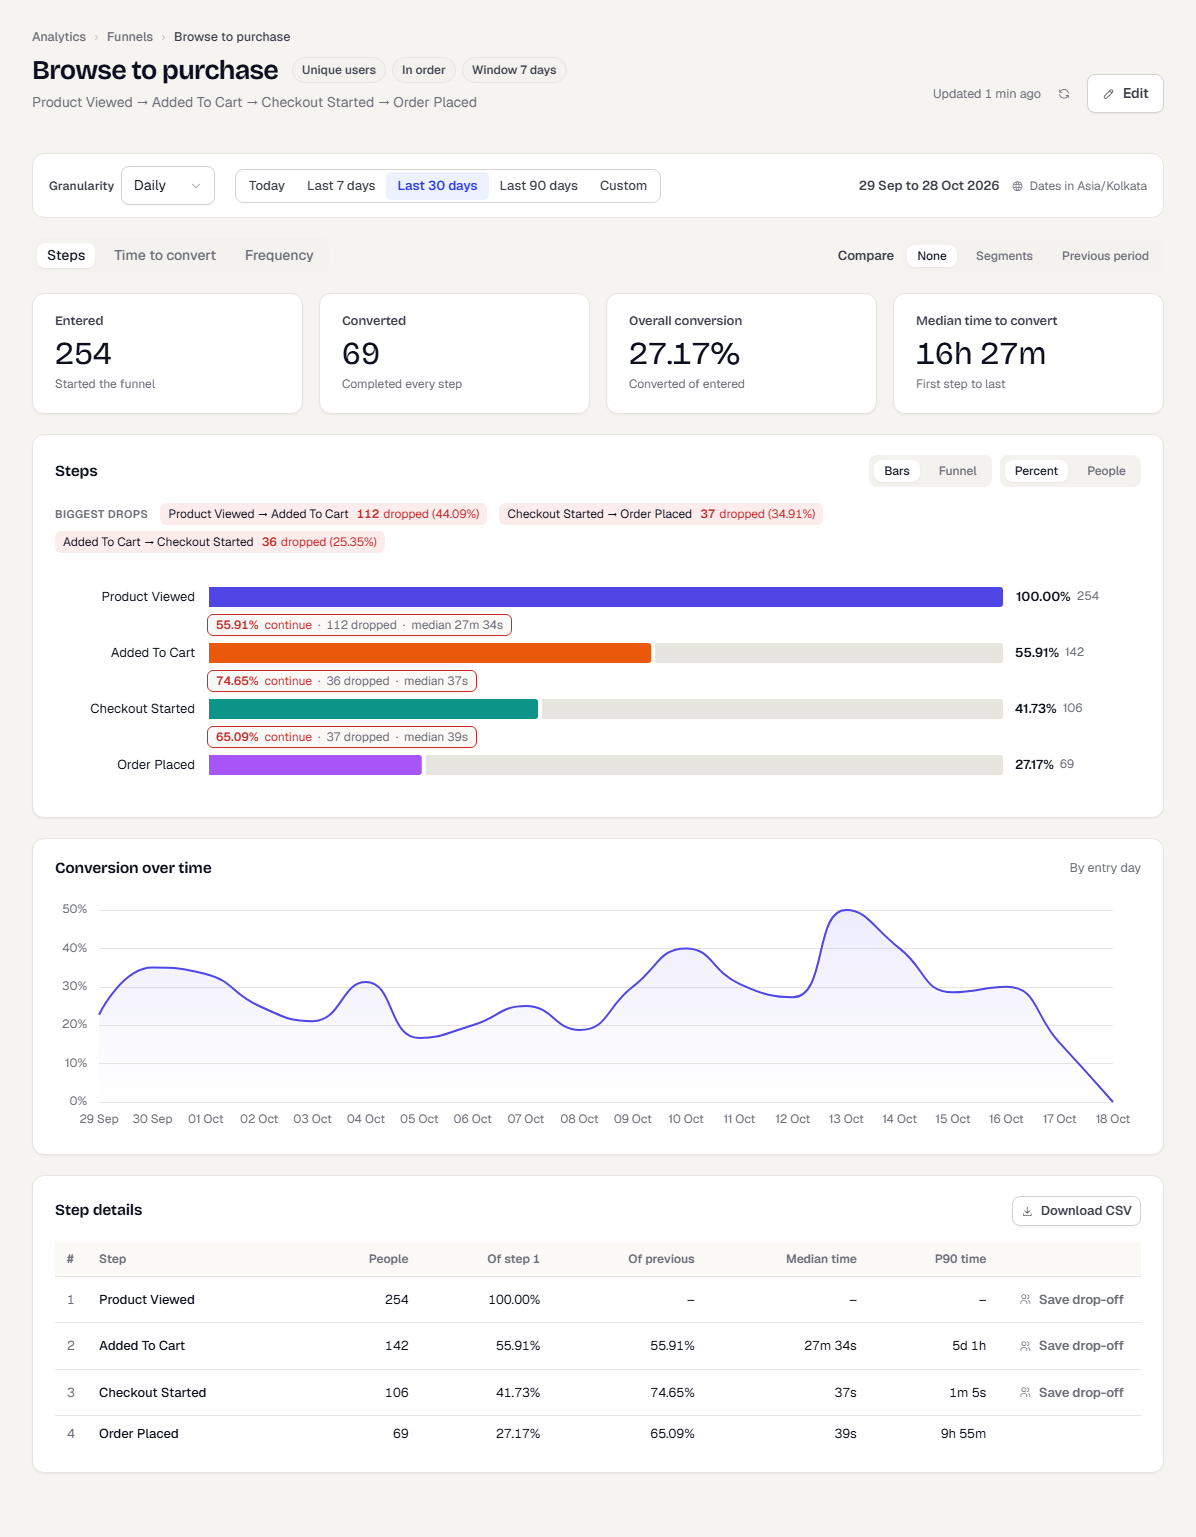
At the top, choose the granularity and the date range (Today, Last 7 days, Last 30 days, Last 90 days or Custom). People are counted if they enter step 1 inside the range. They can finish up to one conversion window after the range ends.
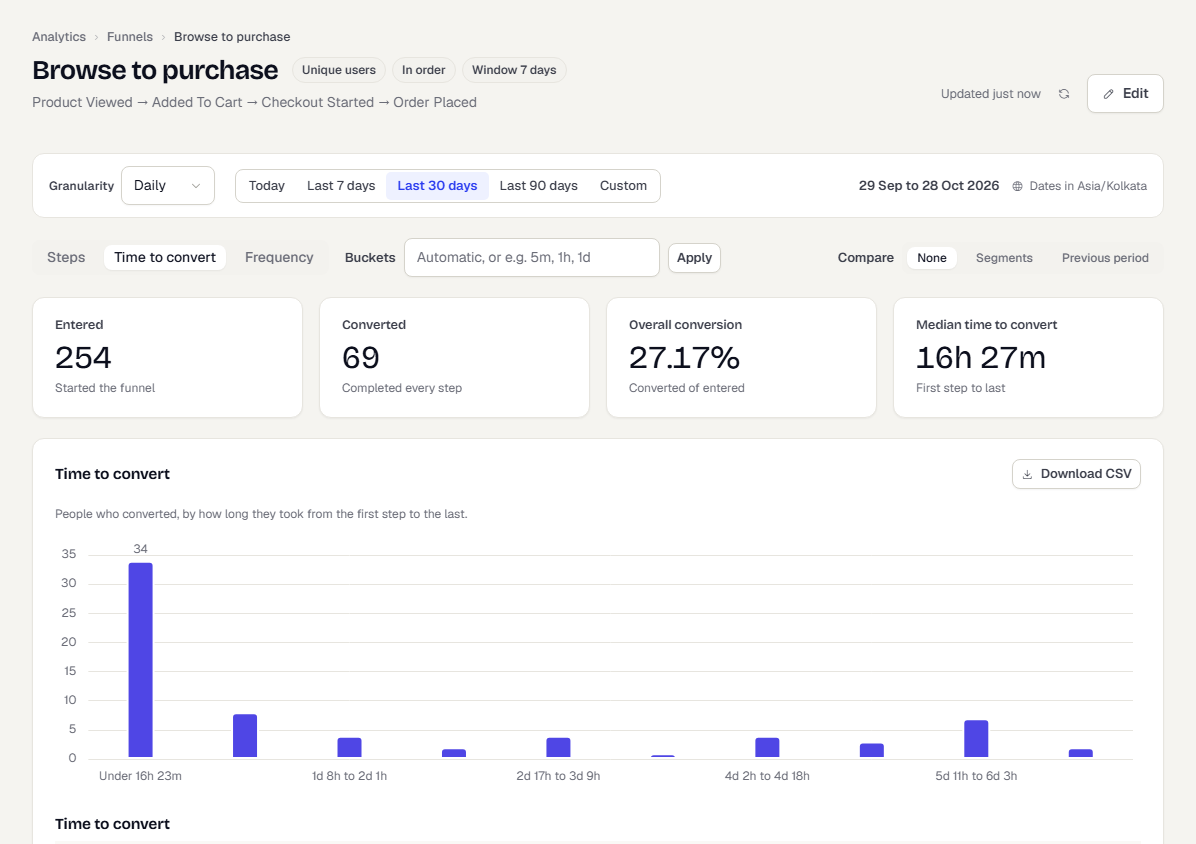
Four tiles summarise the funnel:
| Tile | Meaning |
|---|---|
| Entered | Started the funnel. |
| Converted | Completed every step. |
| Overall conversion | Converted of entered. |
| Median time to convert | First step to last. |
The Steps view has three parts:
- Steps shows the people at each step. A Biggest drops strip above the chart names the three steps where most people left. Switch between Bars and Funnel. With bars, choose Percent or People. Between bars you see how many continue, how many dropped and the median time between steps.
- Conversion over time: the conversion rate for people who entered on each day. Dashed periods are still converting, because people who entered recently still have time to finish.
- Step details: for each step, the People, the share Of step 1 and Of previous, and the Median time and P90 time to reach it. Click Download CSV to save the table.
Find who dropped off
In Step details, click Save drop-off on a row. A dialog, Create segment from drop-off, saves everyone who reached that step but not the next as a segment. It is a snapshot and doesn't update as new people drop off. You need permission to create segments. Use that segment in a campaign to win those people back.
Compare to a segment or the previous period
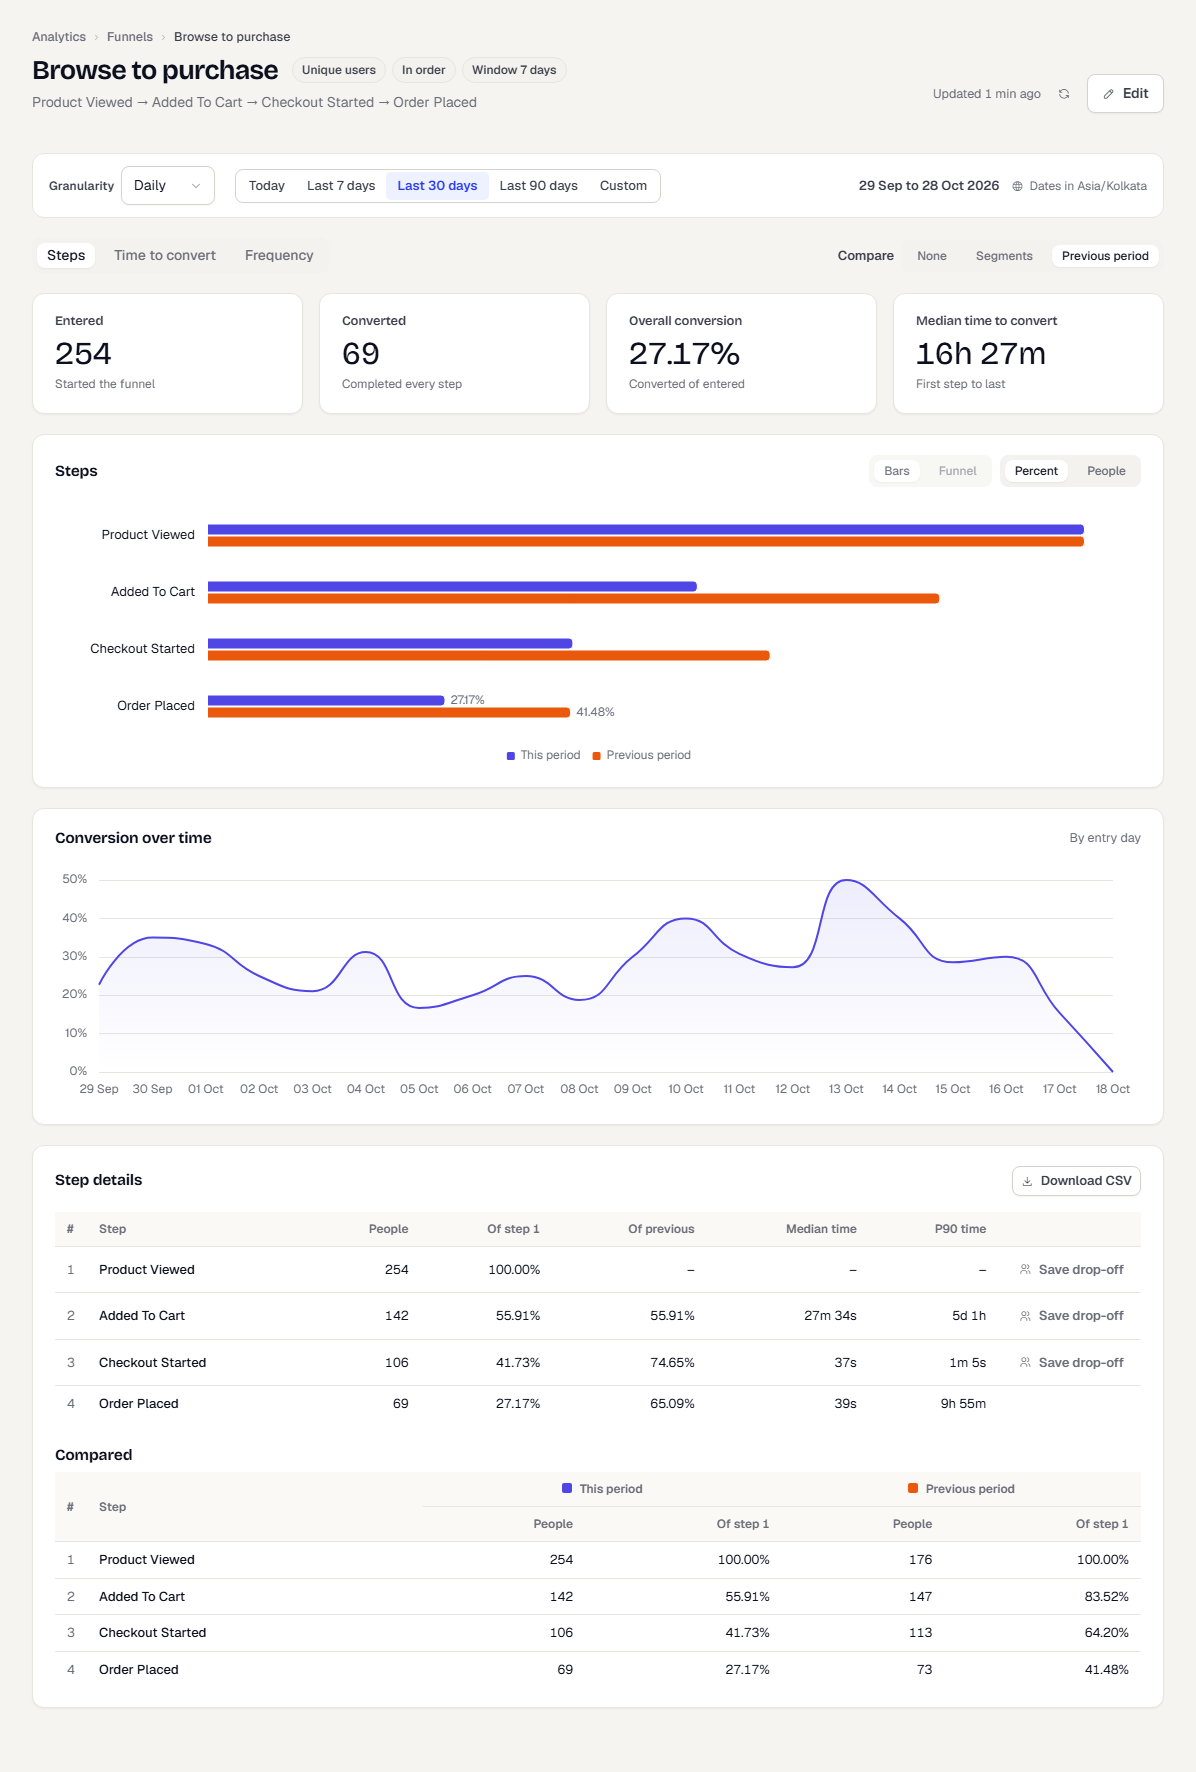
Use Compare above the chart.
- Choose Segments, then pick up to five from the list. Each segment gets its own colour on the chart and its own columns in the table.
- Or choose Previous period to set the funnel against an equally long period just before the range.
- Choose None to go back to the plain funnel.
See how long people take
Switch the view from Steps to Time to convert. The chart shows how long people took from the first step to the last, in buckets, and a table lists the median and slower percentiles (such as P90). To set your own buckets, type edges such as 5m, 1h, 1d in Buckets and click Apply. Leave it empty for automatic buckets. This view isn't available for Any order funnels, because the time between steps isn't defined there.
See how often people repeat a step
Switch to Frequency and pick a Step. The chart shows how many people did that step once, twice and so on, and the By number of times table lists the same counts.
Counting rules in short
- A person enters when they do step 1 inside the date range.
- They have the conversion window, counted from step 1, to finish.
- One event can only move a person forward one step.
- If someone has more events than a funnel can walk, their steps may be undercounted. A note on the results says how many people are affected.
- A funnel never lists individual people.
What happens next
Funnels are saved and appear on the list with their last run. To show one on a dashboard, add it as a tile from the Funnels tab in a custom dashboard. Pick Steps, Trend or Key figure.
Related
Was this page helpful?