Drill into a number
Click a chart or count to see the people behind it, sort and page the list, and save the group as a segment.
Many numbers on the built-in dashboards open a panel with the people behind them. Use it to check a figure, find who to message, or turn a group into a segment.
Who can use this. The people list needs Users > View (users:view). Every default role has it except External. Save as segment also needs Segments > Create and manage (segments:create_manage), which Owner, Admin, Manager, Developer and Marketer have. Showing a person's full email or mobile number needs Users > Download (users:download), which Owner, Admin and Manager have. See Roles and permissions.
Open the list
- Open a dashboard, for example Key Metrics.
- Click a bar, a point on a chart, or a count in a table.
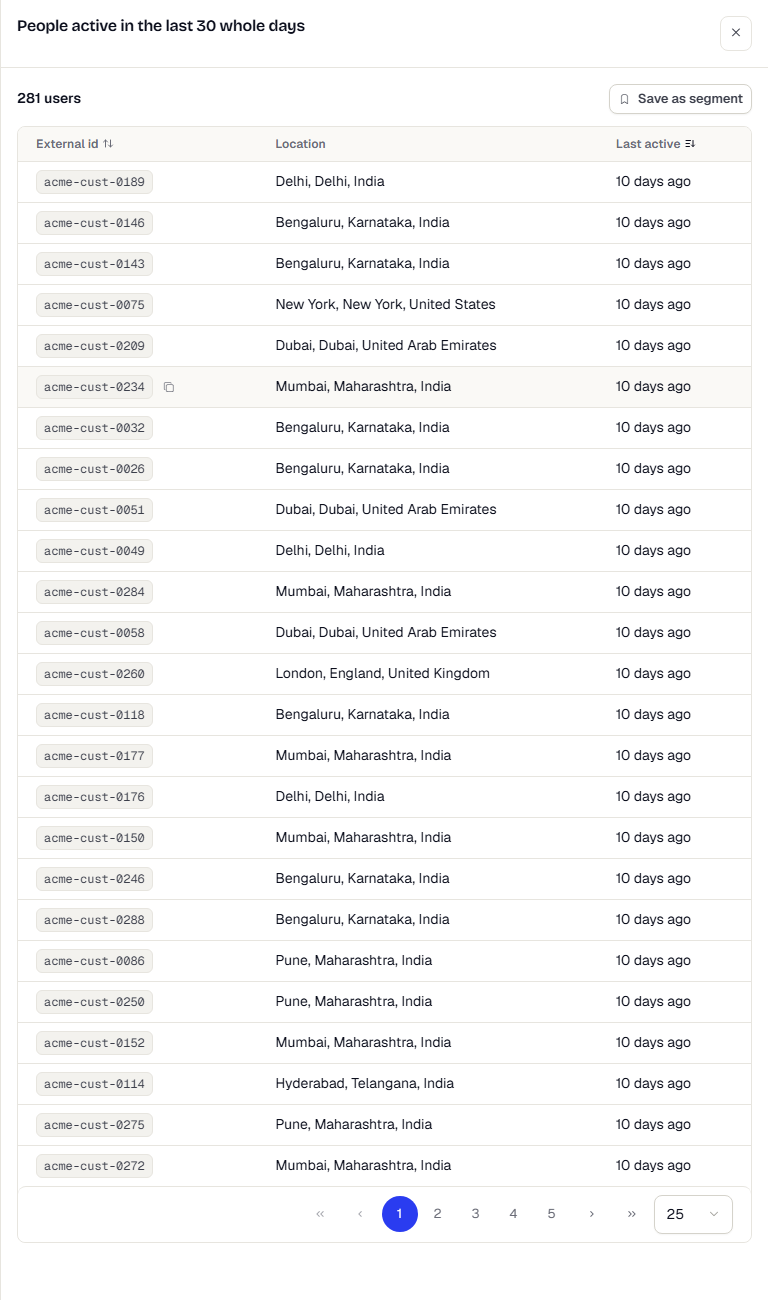
A panel slides in from the right. Its title says which group you are looking at. A line under it says when the tile was computed. The list reads current data, so it can differ slightly from the tile.
Read the list
Each row shows:
- External id: the id your systems use. A person who never identified shows a dash.
- Location: where they are, when known.
- Last active: when they were last seen, in relative time. Hover for the exact time.
Email and phone are masked. Click a row to open the person's profile.
To sort, click External id or Last active. A long list is paged. Use the page controls to move on and the rows-per-page menu to show more. Lists stop after a few thousand people. When that happens, a note asks you to narrow the dates.
Save the group as a segment
- Click Save as segment at the top of the list.
- When it finishes, the button changes to View segment. Click it to open the new segment.
The segment is a snapshot. It holds the people who were in the group when you saved, and it does not change as new people qualify. To get a segment that keeps updating, build one with rules in the segment builder.
If saving fails, the panel says The segment was not saved. Try again. The button is missing if your role cannot create segments.
Two-step drills
Some tiles first show a short table, for example one row per event, with a number and a small arrow. Click a row to open the people behind it. Use the back arrow at the top of the panel to return. If the table is cut short, a note says it shows the largest rows. Narrow the dates to see the rest.
Choose the time column on your own tiles
On event tiles you build yourself, the third column can show when each person last did a particular event, instead of when they were last active.
- Open your custom dashboard and edit or add an event tile.
- Find Drilldown shows.
- Pick Last active (the default) or Last time of an event.
- For the event option, choose the event. Save the tile.
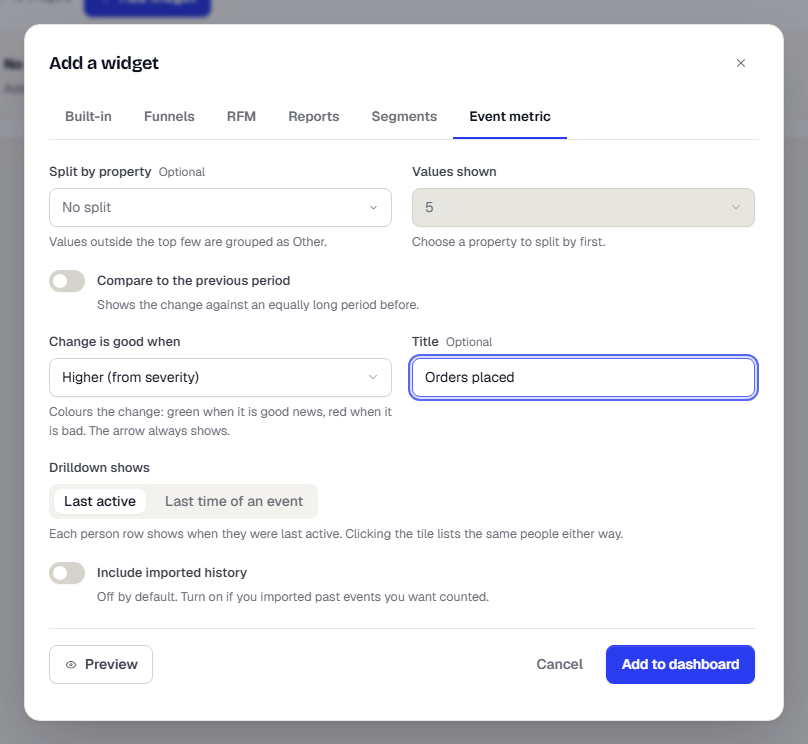
The column then reads Last followed by the event name, and the list opens newest first. The people and the total do not change. The setting appears only on tiles that open a people list: one event with no property filters, shown as a number or as bars of the latest value.
Related
Was this page helpful?