Build a custom dashboard
Combine built-in widgets, funnels, reports, segments and event counts on one page, share it with your team and make it your default.
A custom dashboard is a page of tiles you choose. Use it when the built-in dashboards show more than you need, or when you want a funnel, a report and a count of one event side by side.
Before you start
- You need permission to view analytics to open dashboards, and permission to manage analytics to create or edit them.
- Funnels, reports, RFM models and segments you want on the dashboard must exist first. See Funnels and Reports.
- Only the person who created a dashboard, or the workspace owner, can change it. Everyone else can open it and Duplicate it from the list to make their own copy.
Create a dashboard
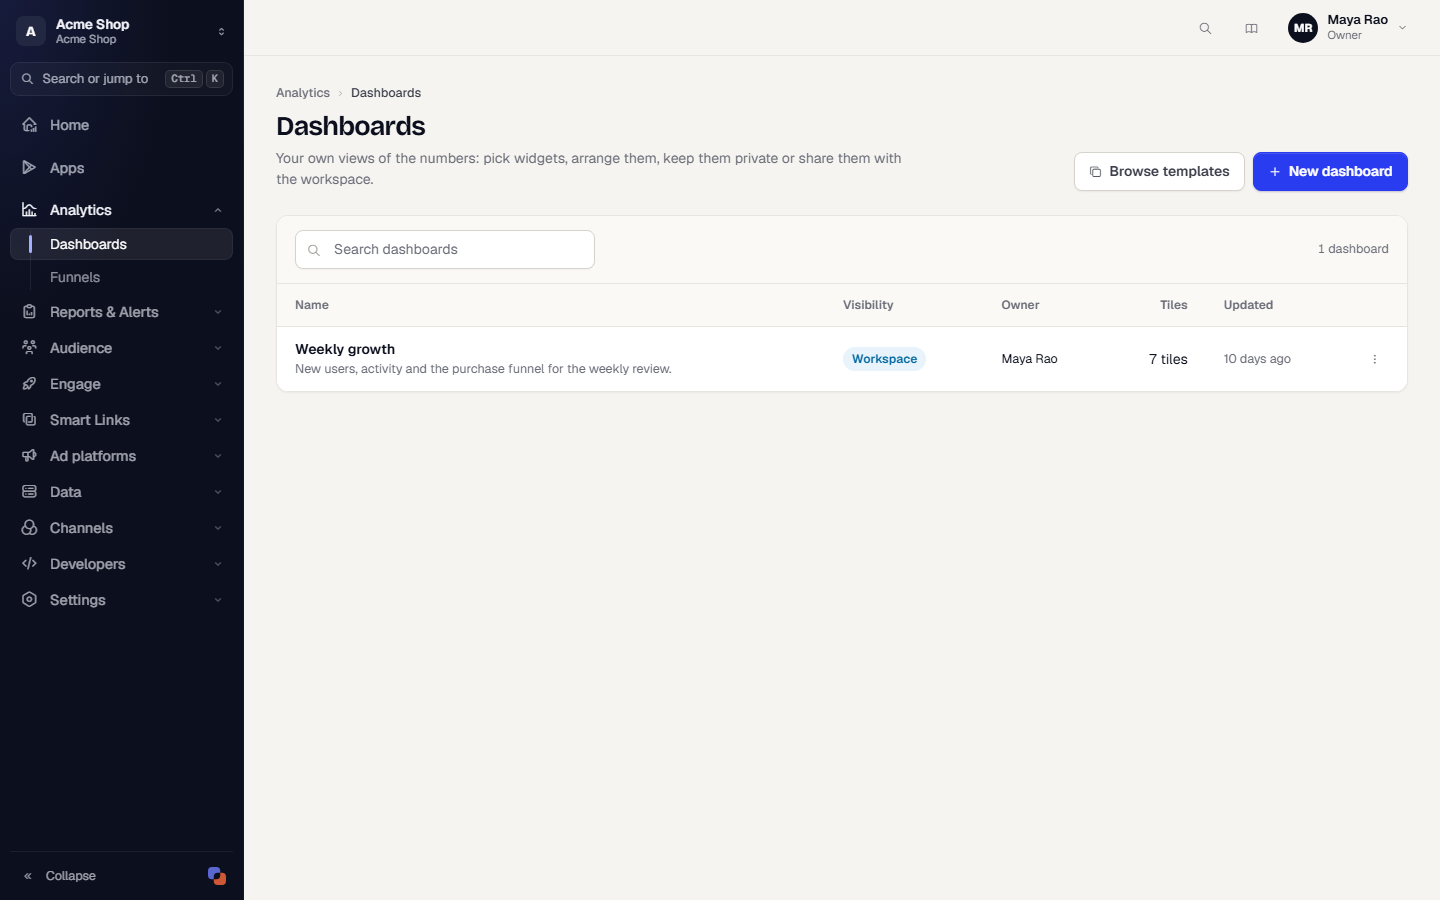
- In the sidebar, open Analytics, then Dashboards, or open the title menu on any dashboard and choose All dashboards. The list shows each dashboard's visibility (Private or Workspace), owner, number of tiles and when it was last updated.
- Click New dashboard. To start from a ready-made one instead, click Browse templates and see Dashboard templates.
- Under Details, type a Name such as Weekly growth. Add a Description if it helps.
- Decide who can open it with Share with the workspace. Off means Private: only you. On means everyone in the workspace who can view analytics can open it.
- Under Default view, choose the Date range and Granularity the dashboard opens with. Viewers can change both while looking. Hourly needs a range of 31 days or less.
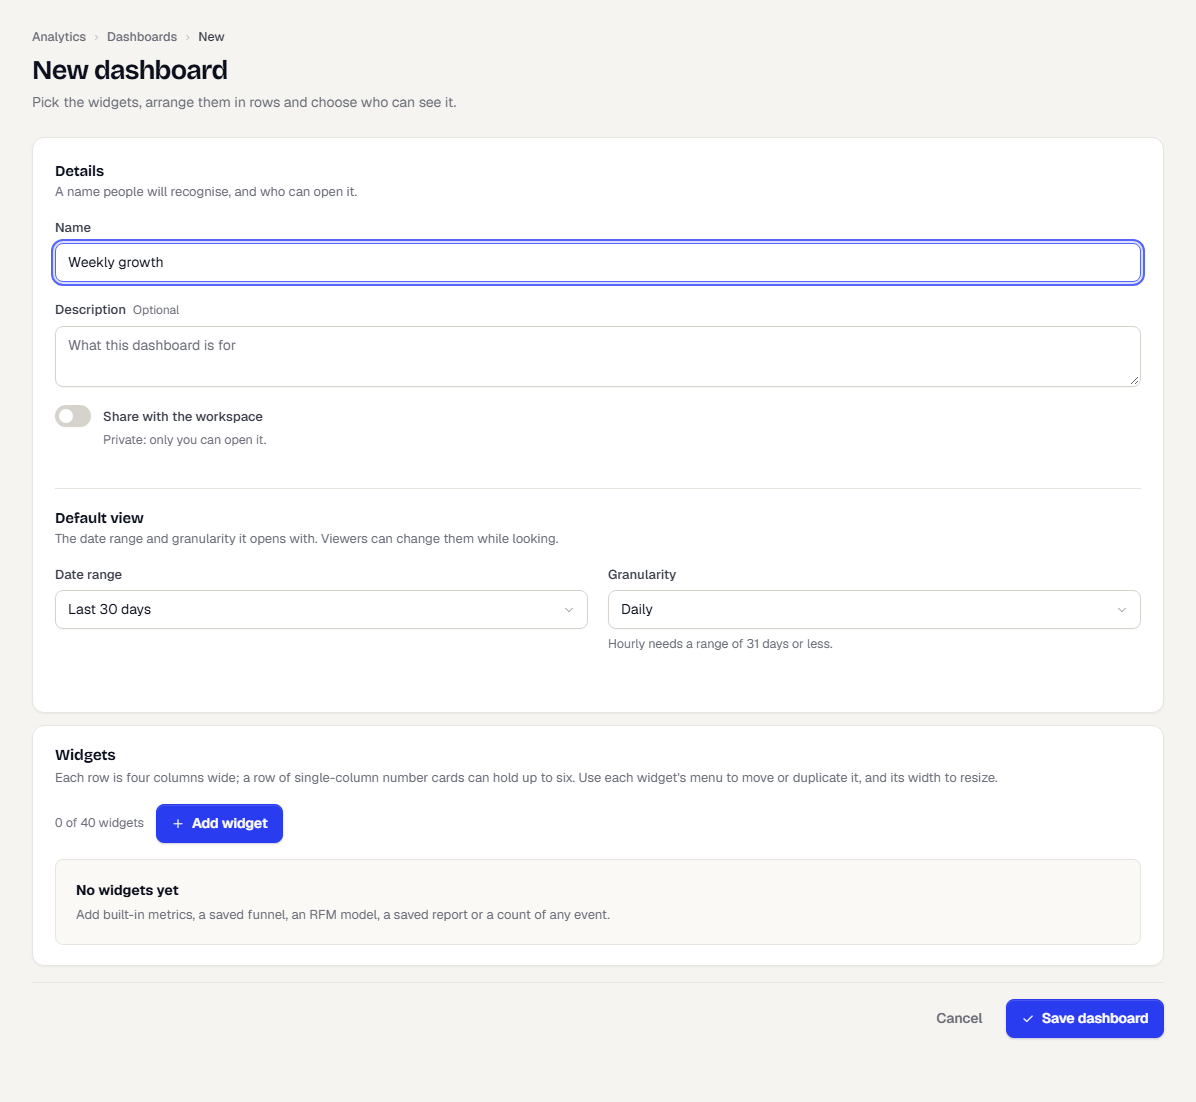
Add widgets
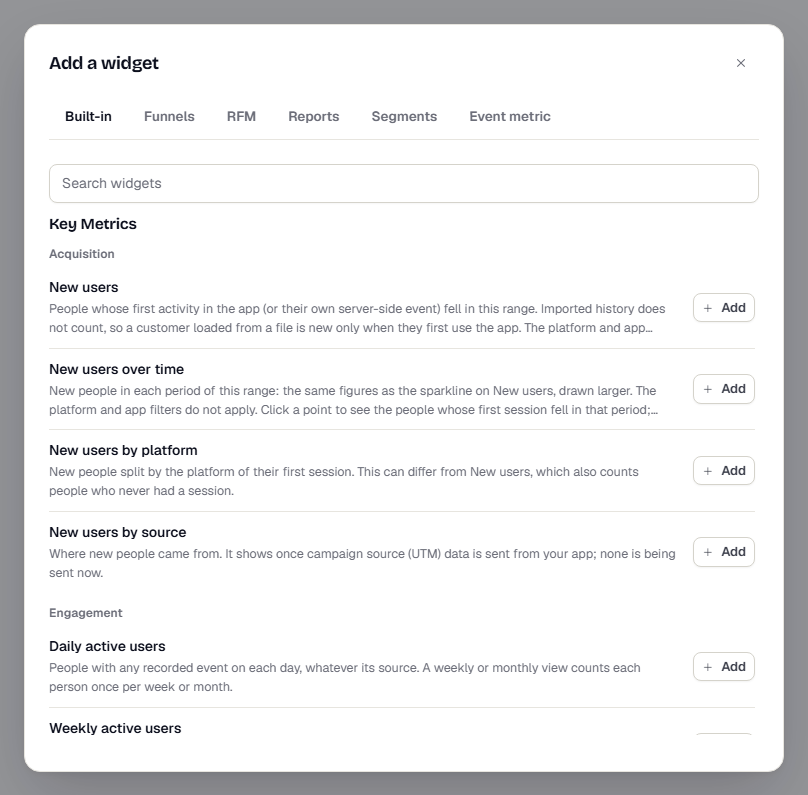
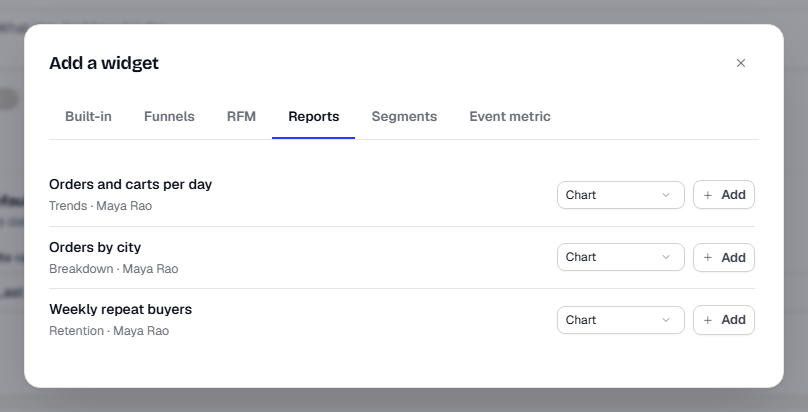
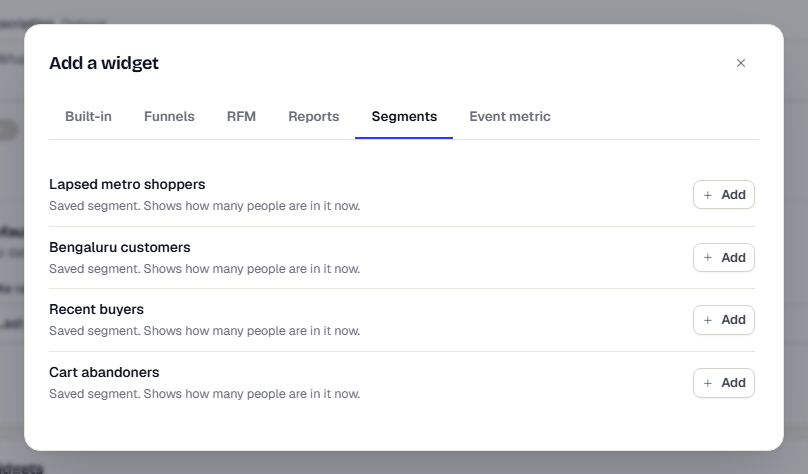
- Click Add widget. The Add a widget dialog opens with six tabs. Each tab adds a different kind of tile.
| Tab | What you can add |
|---|---|
| Built-in | Any tile from the built-in dashboards, grouped by dashboard and section. Use Search widgets to find one. |
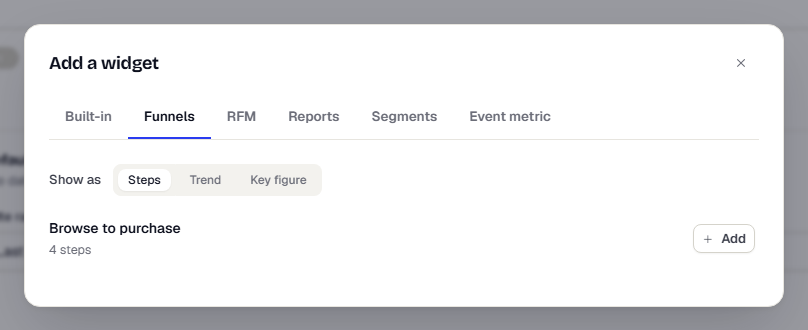
| Funnels | One of your saved funnels. Choose Show as: Steps, Trend or Key figure. |
| RFM | One of your RFM models. Choose Show as: Grid or Summary. |
| Reports | One of your saved reports, as a Chart, a Table or a Key figure. Breakdown reports have no key figure. |
| Segments | A card showing how many people are in a saved segment now. |
| Event metric | A count of any event, built right here. See Measure an event. |
- On Built-in, find a tile and click Add next to it. The dialog stays open so you can add several. Close it when you're done.
- To add a funnel, open Funnels, choose how to show it and click Add next to its name. If the tab says No saved funnels yet, create one first.
- The RFM, Reports and Segments tabs work the same way. A segment card shows its latest count and the time it was counted. If that count is more than an hour old, TrueEngage recounts in the background and marks the card as updating. Click the card to open the segment.
Measure an event
The Event metric tab counts events you choose, with no report to save first.
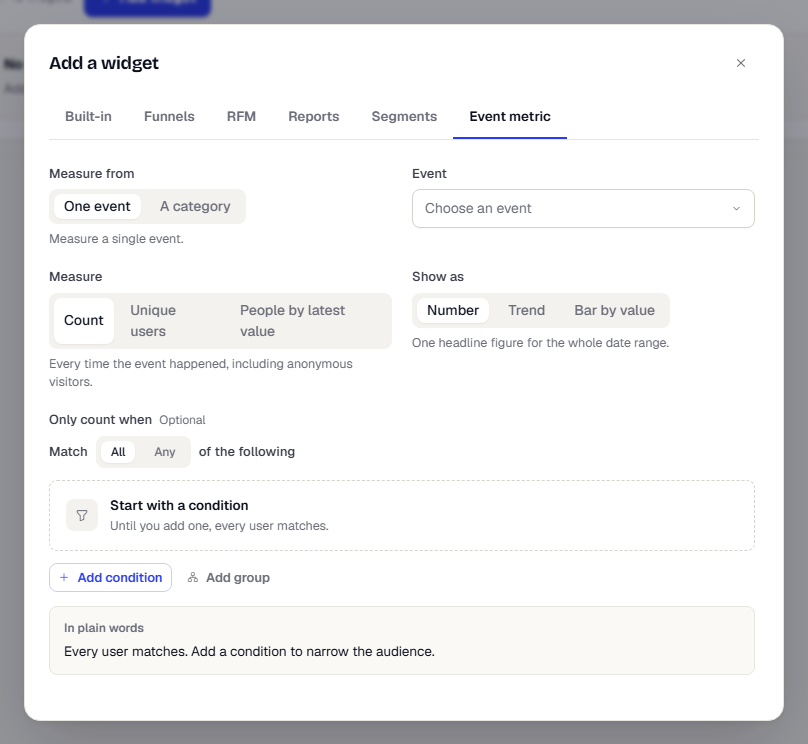
- Under Measure from, choose One event or A category. A category adds up every event in that category, including events added to it later. Categories come from Connect > Events.
- Pick the Event (or Category).
- Choose a Measure:
- Count: every time the event happened, including anonymous visitors.
- Unique users: each identified person once.
- People by latest value: each identified person once, under the value of their most recent occurrence. Choose Group people by a property and Count each person by Where people are now or Within the date range.
- Choose Show as: Number, Trend or Bar by value. A bar needs a property in Split by property.
- Optionally add Only count when conditions to narrow which events count.
- For a number, turn on Compare to the previous period to show the change. Set Change is good when to Higher, Lower or Neutral so the change is coloured correctly.
- Optionally type a Title. If you leave it empty, the tile is named from the event, for example Count of Order Placed, trend.
- Leave Include imported history off unless you want events you imported to count.
- Click Preview to see the values, then click the add button at the bottom of the form.
Arrange the tiles
Tiles sit in rows. A row is four columns wide.
- Give a row a name in its Row heading (optional) box. The name appears above the row on the dashboard.
- Change a tile's width with the 1 of 4 to 4 of 4 menu on the tile. The other tiles in the row resize to fit. A row of four to six single-column tiles becomes a row of equal cards, which suits number tiles.
- Use the arrows next to a row heading to move the whole row up or down.
- Click the More actions button on a tile to Move left, Move right, Move up, Move down, Duplicate or Remove it.
- On an event metric tile, click the pencil button to change its settings in the Edit event metric dialog.
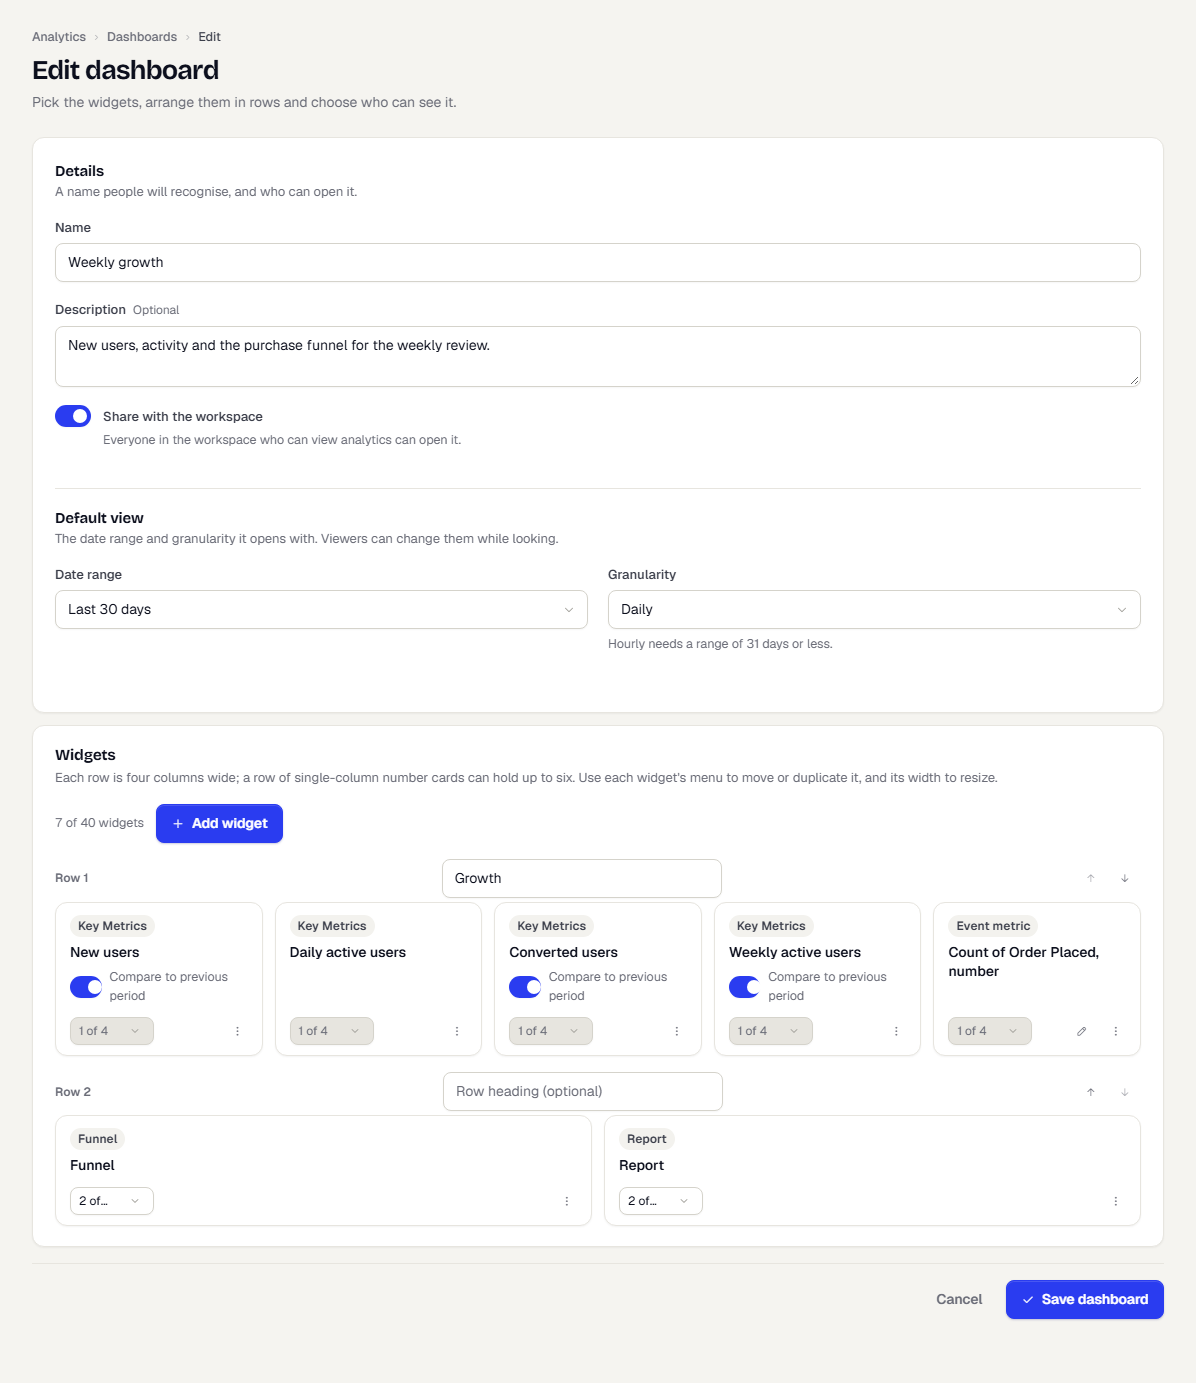
Limits: 40 tiles, 20 rows and 12 event metrics per dashboard, and 12 report tiles. Report and event metric tiles together are limited to 16. The counter above the Add widget button shows how many tiles you've used.
Compare to the previous period
Number tiles from the built-in dashboards, and funnel tiles shown as Key figure, have a Compare to previous period switch in the editor. It is on by default. When on, the tile shows the change against an equally long period just before the date range. Turn it off for a plain number.
Save and view
- Click Save dashboard. The dashboard opens.
- Use Granularity and the date chips (Today, Last 7 days, Last 30 days, Last 90 days, Custom) to explore. These changes are only for you while you look.
- To keep a range for everyone, change it, then click Save range as default. It appears when your view differs from the saved one and you can edit the dashboard.
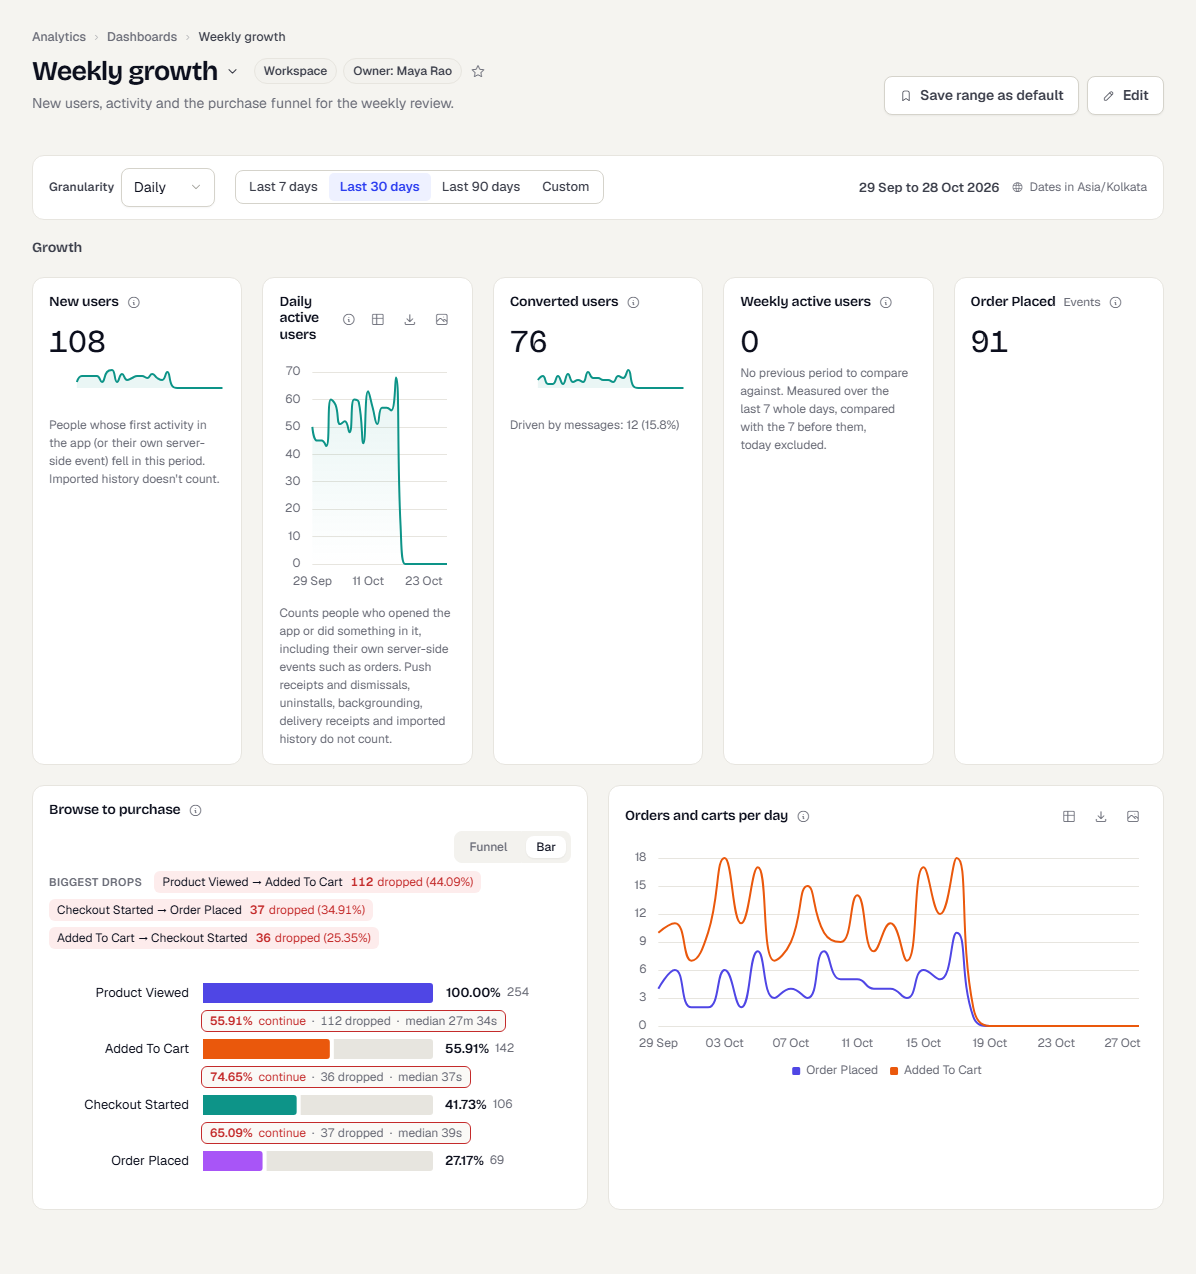
Click Edit to change the dashboard later. Click a chart on a tile to see the people behind a point, where the tile supports it.
Email a dashboard on a schedule
Select Schedule email at the top of a saved dashboard to have its headline numbers sent to your team every day, week or month. The email shows each widget's value with the change from the previous period, the top rows of list widgets and a View dashboard button. Charts are not drawn in the email. See Email a report on a schedule for the steps and the rules.
Make it your default
Click the star next to the dashboard name. Analytics now opens this dashboard for you. Click the star again to clear it. A Default tag shows beside the dashboard in the list and in the title menu.
If someone else saved first
If a teammate saves a dashboard while you are editing it, your save isn't applied. A yellow message appears: Someone else saved this dashboard while you were editing, so your save was not applied. Reload to see their version. Your unsaved changes will be lost. Click Reload, then redo your change on top of theirs.
Duplicate or delete a dashboard
In the list, open the actions menu on a row. Open, Edit and Duplicate are there for anyone. Edit and Delete appear only if you created the dashboard or you are the workspace owner. A copy starts as Private and belongs to you.
What happens next
A shared dashboard shows up for everyone with analytics access, in the title menu under shared dashboards. If you later delete a funnel, report or model a tile points to, the tile shows as removed. Edit the dashboard to remove it.
Related
Was this page helpful?