Built-in dashboards
What every tile on Key Metrics, Campaign Stats, Activity View, Deliverability and Reachability means, and how to change the date range, filters and default.
TrueEngage ships five dashboards that need no setup. In the sidebar, open Analytics, then Dashboards, and pick one from the title menu. Two more, Smart Links and Marketing, appear only if your role allows them. Smart Links shows link clicks and installs. It is also under Smart Links, then Analytics. See Link analytics. Marketing shows ad spend and results. See Marketing dashboard. This page explains how to use the controls they share, then what each tile counts.
Who can use this. Every dashboard needs permission to view analytics. Smart Links also needs Smart links > View (smartlinks:view, all default roles). Marketing also needs Acquisition & Spend > View spend (acquisition:view_spend; Owner, Admin, Marketer and Analyst by default, not External). A dashboard you lack the permission for is missing from the menu, and opening its link takes you back to the dashboard list. See Roles and permissions.
Before you start
- You need permission to view analytics.
- Dashboards read the environment you are in. Check the Test or Live switch in the top bar.
- Numbers lag a little. A line next to the section tabs says when the data was last computed, for example Latest complete day: 17 Oct.
Open a dashboard
- In the sidebar, open Analytics, then Dashboards. You land on the dashboard you opened last, or Key Metrics the first time. If you set a default, you land on that instead.
- Click the dashboard title at the top of the page. The Switch dashboard menu opens.
- Pick Key Metrics, Campaign Stats, Activity View, Deliverability or Reachability. Your own dashboards and installed templates are listed in the same menu. Type in Search dashboards to filter.
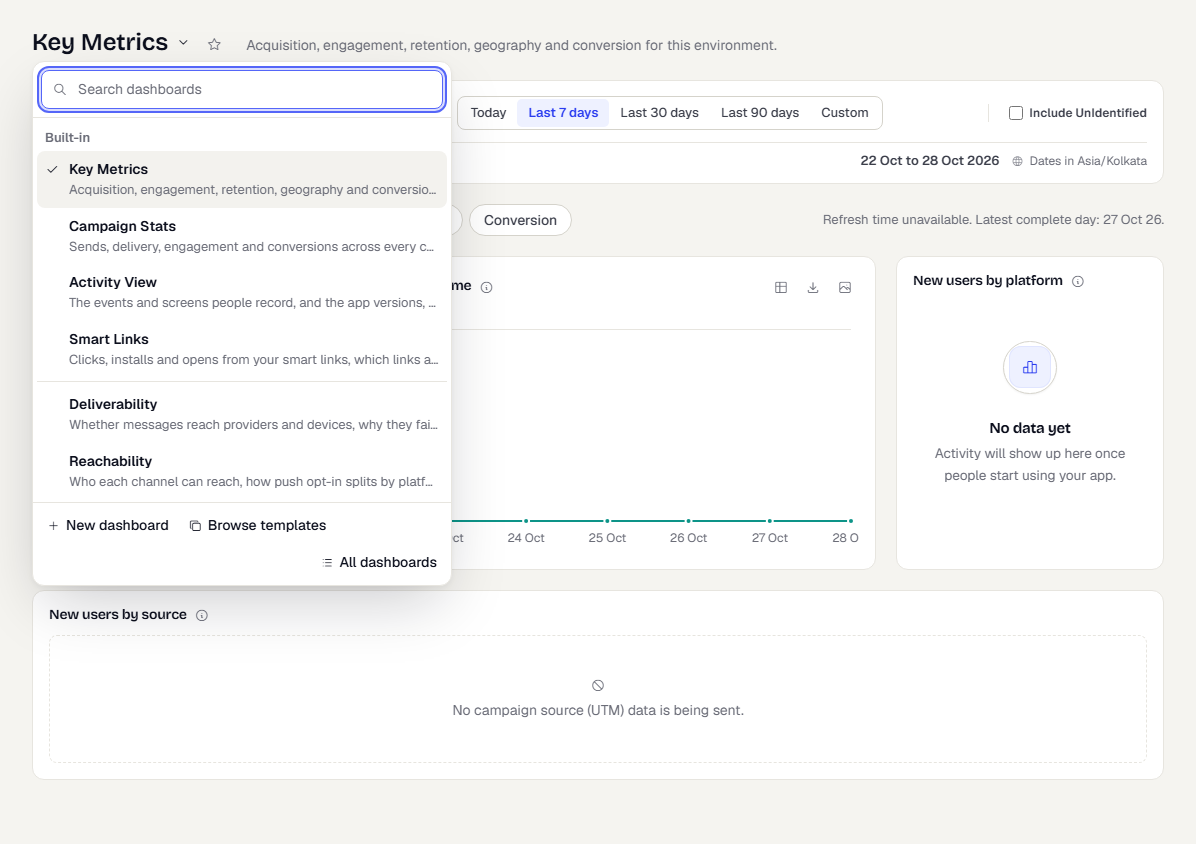
The menu footer has New dashboard, Browse templates and All dashboards. To build your own, see Custom dashboards.
Change what a dashboard shows
The filter bar sits under the title. Which controls you see depends on the dashboard and the tab you are on.
- Pick a Platform: All platforms, Android, iOS or Web. A few tiles ignore this filter. Their help text says so.
- Pick a Granularity: Hourly, Daily, Weekly or Monthly. Hourly is available for ranges of 31 days or less.
- Pick a date range with Today, Last 7 days, Last 30 days or Last 90 days. Choose Custom to pick a start and an end date in the calendar.
- Tick Include UnIdentified to count anonymous installs as well as people you have identified.
The line under the filters shows the exact dates and the time zone they were cut in.

Two dashboards add filters of their own:
- Campaign Stats shows an Attribution menu: Messages marked converted (the default), Click-through, View-through or In-session. It decides how a conversion is credited to a message. The window each mode uses is shown next to the menu. A note on this dashboard says the Include UnIdentified filter does not apply to its numbers, which always include people who never identified themselves.
- Key Metrics > Conversion shows a Conversions menu: All conversions, Conversion events (events you mark as conversions in Data > Data Management > Events) or Campaign & flow goals.
- Activity View > Events shows an Events switch (All, Custom, Standard) and a Severity filter. Standard events are the ones the SDK records itself, such as screen views and app opens.
Read a tile
Every tile has an i icon. Hover or focus it to read exactly what the tile counts. Tiles that show a single number also show the change against the previous period of the same length, in green when it is good news and red when it is not.
Click a point or bar on many charts to see the people behind it. A panel opens with a masked list showing External id, Location and Last active. You can sort and page it. Use Save as segment in the panel to turn that group into a segment. It is saved as a snapshot of who is in the group now. For the details, see Drill into a number.
Download a tile's data
Tiles with a chart or table have small buttons in the top right.
- The table icon switches between the chart and its data table.
- The download icon (Download data as CSV) saves the numbers as a CSV file.
- The image icon (Download chart as PNG) saves the chart as a picture.
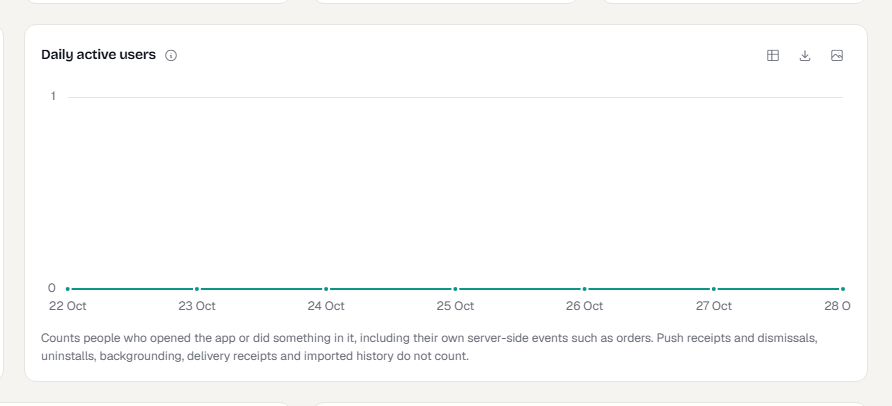
CSV files hold the aggregate figures shown on the tile. They never contain people's details.
Make a dashboard your default
Click the star next to the dashboard title. The star fills and the tooltip reads Your default dashboard. Click to clear. From then on, Analytics opens that dashboard for you. The choice is per person and per workspace, so it doesn't change what your teammates see. Click the star again to clear it.

Key Metrics
Acquisition, engagement, retention, geography and conversion, in five tabs. Percent changes compare with the previous period of the same length.
Acquisition
| Tile | What it counts |
|---|---|
| New users | People whose first activity in the app, or their first server-side event, fell in the range. Imported history doesn't count. |
| New users over time | The same people, by period. |
| New users by platform | New people by the platform of their first session. |
| New users by source | Where new people came from, once your app sends campaign source (UTM) data. |
Engagement
| Tile | What it counts |
|---|---|
| Daily active users | People with any recorded event on each day. Weekly and monthly views count each person once per week or month. |
| Weekly active users, Monthly active users | People with any event in the 7 or 30 whole days ending today. These ignore the date range and the platform filter. |
| Dormant users | People whose last activity was 30 or more days ago. |
| Stickiness | Average daily active people over the last 30 whole days, as a share of people active at least once in those days. |
| Session duration, Session duration by platform | Average session length. Sessions with no recorded duration are left out. |
| Bounce rate, Bounce rate over time | Share of sessions in which the person viewed at most one screen. |
Retention
| Tile | What it counts |
|---|---|
| Retention cohorts | Each row is people whose first activity fell in one week. Each column is the share of them active again that many weeks later. Week 0 is always 100%. |
| Uninstalls | Estimated app removals detected in the range. Detection relies on push signals, so a day can spike when a sweep catches up. |
| Lifecycle | People grouped by how many days ago they were last active. |
Geography
| Tile | What it counts |
|---|---|
| Active people by country, region, city | People with a session in the range, by where they are now. Click a country, region or city to see the people. |
| New users by country | New people by their current country. People with no known location show as Unknown. |
Conversion
| Tile | What it counts |
|---|---|
| Conversion rate | People who did a conversion event after opening the app in the range, as a share of everyone who opened the app. |
| Time to convert (median), (90th percentile), by duration | How long converters took from their last app open to their first conversion. |
| Converted users | People who did at least one conversion event in the range. |
| Conversion events | How many conversion events happened, counting every occurrence. |
Campaign Stats
Sends, delivery, engagement and conversions across every campaign and channel. The first tab, Overall Performance, covers everything. The other tabs cover Push, Push engagement, Email, SMS, Flows, In-App, On-Site and Web Personalization.
| Tile | What it counts |
|---|---|
| Sent | Messages handed to a provider in the range. |
| Delivered | Messages the device or inbox provider accepted. It says nothing about whether anyone saw them. |
| Delivery rate | Delivered as a share of sent. A low rate is a provider or address problem. |
| Unconfirmed sends | Messages sent, not failed, with no delivery receipt after 24 hours. |
| Opened, Open rate | Emails opened, and as a share of emails delivered. Push doesn't report opens. |
| Clicks | Messages clicked at least once. It counts messages, not click events. |
| Conversions, Conversion rate | Messages marked converted (or credited under the attribution mode you picked), and that count as a share of delivered. |
| Click-through rate | Messages clicked as a share of delivered messages (of opened, for email). |
| Sent, Delivered, Opened, Clicks and Click-through rate by channel | Each channel's share, so you can compare channels. |
| Best / Weakest campaigns by conversion rate and by click-through rate | Up to three campaigns at each end. A campaign needs at least 50 delivered messages to be ranked. |
A table of channels sits under the tiles on Overall Performance.
Push engagement looks at what delivered campaign and flow pushes did on the device.
| Tile | What it counts |
|---|---|
| Delivered pushes | Campaign and flow pushes that reached a device. Template test sends are left out. |
| Click rate | Delivered pushes that were tapped. |
| Dismiss rate | Delivered pushes swiped away without a tap. Android reports dismissals. iOS doesn't, so iOS is left out of this figure. |
| No response | Delivered pushes that were neither tapped nor reported dismissed. |
| People reached | People who were delivered at least one push in the range. |
| Uninstalled within 7 days of a push | People who were sent a push and uninstalled within 7 days, as a share of everyone sent a push. |
| Session length after a push click, Screens after a push click | Average session length and screens viewed in sessions that contain a push click, with the figure for all sessions below for comparison. |
| Push outcomes by platform | Tapped, dismissed and no response for each platform. |
| Pushes per person, Dismiss rate by pushes received | How many pushes people received, and how the dismiss rate changes with that. |
Activity View
What people do in the app, and on what. Four tabs: Events, Screens, Technology and By time.
| Tab | Tiles |
|---|---|
| Events | Events (everything recorded, including the SDK's own), People, Events per person, Event volume, Events over time (top events, one line each), Top events, Events by severity (severity is set per event in Data Management), Top events by people. |
| Screens | Screen views, Distinct screens, Top screens, Screen views over time. Views with no screen name aren't counted. |
| Technology | People by app version, People by platform, People by SDK version. A person counts under every version or platform they used. |
| By time | Busiest hour, Activity by weekday, Activity by hour, Activity by weekday and hour. Use it to choose when to send. |
Deliverability
Whether messages reach providers and devices, why they fail and who is suppressed.
| Tile | What it counts |
|---|---|
| Sent, Delivered | Messages handed to a provider, and those the provider confirmed with a receipt. |
| Failed | Messages the provider reported as failed or bounced. |
| Unconfirmed | Messages accepted with no receipt after 24 hours that didn't fail. Usually the device was offline or the app was uninstalled. |
| Sent, delivered, failed and unconfirmed over time | The four counts in each period. The last period is still in progress. |
| Delivery rate by provider, Failure rate by provider | Each provider's rates, to compare vendors. |
| Failure reasons, Provider reasons | Why messages failed, as a share of all failures. |
| Bounce types | Hard bounces are permanent (a bad address). Soft bounces are temporary (a full inbox). Email only. |
| Suppressed now, Newly suppressed, Suppression reasons | Addresses and devices on the suppression list now, added in the range, and why they are there. |
Reachability
Who each channel can reach right now, and how push opt-in splits by platform and over time.
| Tile | What it counts |
|---|---|
| Push opt-in rate | Of people holding an active push token, the share who have notifications on. |
| Push opted out | People who held a push token and turned notifications off. A rise is bad news. |
| Reachable by email, SMS, WhatsApp | People the send gate would let a message reach today. The platform filter doesn't apply. |
| Reach rate by channel | The share of all people each channel can reach. |
| Suppressed addresses | Addresses and numbers we won't send to, by channel and reason. |
Marketing
What your connected ad platforms report: spend per currency, platforms ranked by share of spend with CTR, CPC and CPM, spend, impressions, clicks and cost-per-result charts, and clicks split by region, age group and gender. It has its own filters (Connection, Group by, Currency) and is explained on Marketing dashboard.
What happens next
Dashboards refresh when you change a filter. To keep a particular set of tiles and a default range, build a custom dashboard.
Related
Was this page helpful?