Marketing dashboard
See what your connected ad platforms spend and deliver, compare platforms, switch currency and read who your ads reached.
The Marketing dashboard shows what your connected ad platforms report: how much you spent, how many people saw and clicked your ads, and how each platform compares. It sits with the other built-in dashboards. Use it to check that spend is on track and to find the platform that costs least per click.
Who can use this. You need Acquisition & Spend > View spend (acquisition:view_spend). The default roles that have it are Owner, Admin, Marketer and Analyst. Without it, the dashboard is missing from the menu. See Roles and permissions.
Before you start
- Connect at least one ad platform, for example Google Ads or Meta. Until a connection has synced, the page tells you what is missing.
- Check the Test or Live switch in the top bar. The dashboard reads the environment you are in.
- Numbers come from the ad platforms, so they lag a little. A line under the filters says when they last synced.
Open the dashboard
- In the sidebar, open Analytics, then Dashboards.
- Click the dashboard title and pick Marketing from the Switch dashboard menu.
Choose what to look at
The filter bar sits under the title.
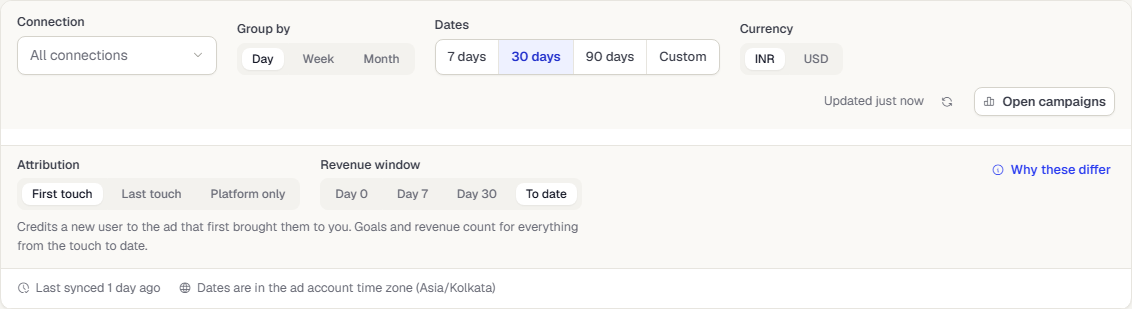
- Pick a Connection to look at one ad account, or leave All connections.
- Under Group by, pick Day, Week or Month. This sets how finely all the charts are cut.
- Pick the Dates.
- If your platforms spend in more than one currency, a Currency switch appears. Pick the currency you want to read.
Click Clear filters to start over. Click Open campaigns to go to the campaign list with the same filters.
Why there is a currency switch
TrueEngage never adds amounts in different currencies. Everything on the page is in the currency you pick, and a note says so. To read the other currency, switch.
Read the totals
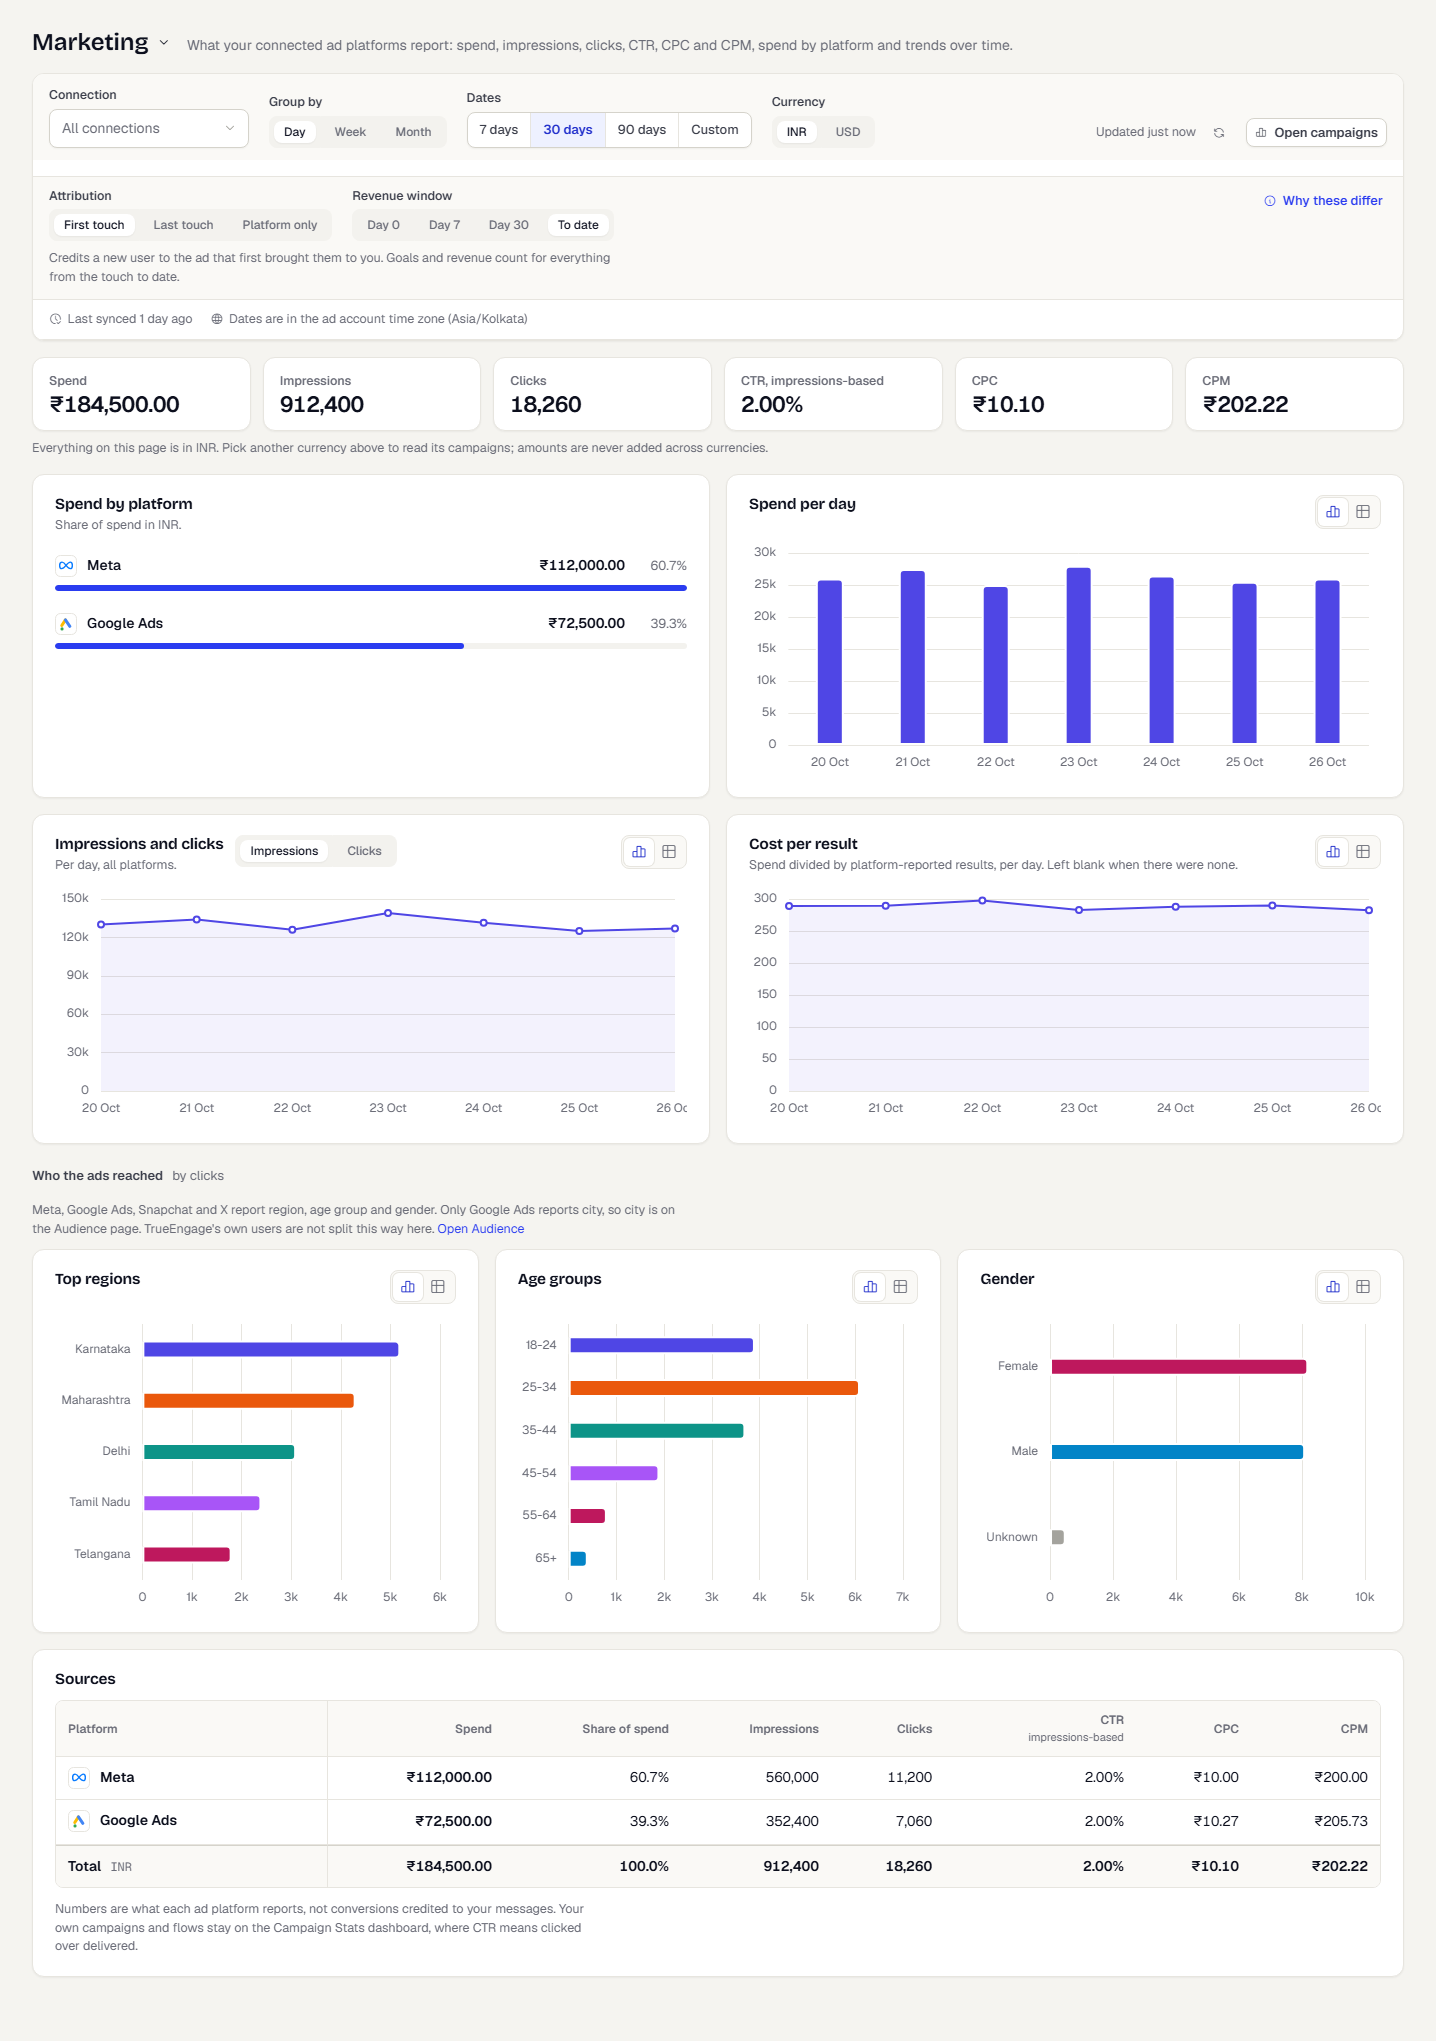
The tiles at the top show, in the chosen currency: spend, impressions, clicks, click-through rate (CTR, clicks divided by impressions), cost per click (CPC) and cost per thousand impressions (CPM). These are the figures each platform reports. They are not conversions credited to your own messages. Those stay on Campaign Stats, where CTR means clicked divided by delivered.
Compare platforms
Spend by platform ranks your platforms by share of spend, each with a bar. Click one to open its campaigns.
The Sources table lists the same platforms with Spend, Share of spend, Impressions, Clicks, CTR, CPC and CPM, and a total row.
Read the charts
- Spend per day (or week or month) shows spend over time.
- Impressions and clicks shows one measure at a time. Use the Impressions / Clicks switch above the chart.
- Cost per result divides spend by the results the platform reports, such as purchases or leads. A period with no results is left blank.
Each chart card has a button that switches between the chart and its data table. The table holds the same numbers, which helps when you want exact values.
See who your ads reached
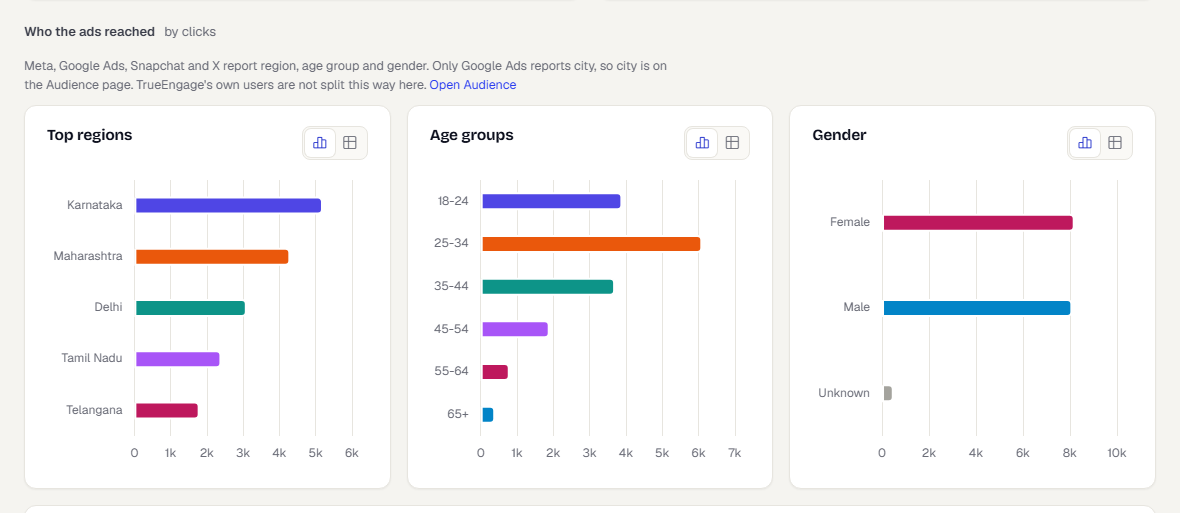
Under the charts, Who the ads reached splits clicks by Top regions, Age groups and Gender. Each is a horizontal bar chart, longest first. Switch any of them to a table with the card's button.
Platforms differ in what they report. Meta, Google Ads, Snapchat and X report region, age group and gender. Only Google Ads reports city. Use the Open Audience link for city detail. If no platform reported a split for your dates, the card says so.
Add your own counts to the platform numbers
The Attribution menu under the filters lets TrueEngage show its own counts next to what the platforms report: First touch, Last touch or Platform only. Revenue window (Day 0, Day 7, Day 30 or To date) sets how long after sign-up goals and revenue still count.
With First touch or Last touch, the page adds a Counted by TrueEngage group: new users, cost per new user, goal users, cost per goal, revenue and ROAS (revenue divided by spend). Platform results and new users are different stages, so they are never added together. Click a count to see the people behind it. See Drill into a number.
Join quality shows how much of your new users and spend could not be tied to a campaign. Tag your ad links with the campaign id (utm_campaign) to improve it.
When the page is empty
- You cannot view ad spend. Your role lacks the permission above. Ask an owner or admin.
- Set up needed. No ad platform is connected or synced yet. Follow the link on the page.
- Nothing in these dates. Widen the dates or click Clear filters.
Related
Was this page helpful?