Build a report
Create Trends, Breakdown and Retention reports from your events, run them, and save them to reuse or add to a dashboard.
A report answers one question about your events. Pick the kind that fits the question, run it, and save it if you want to come back to it.
| Kind | It answers | Example |
|---|---|---|
| Trends | How often events happen over time, with up to five series at once. | Orders placed per day, next to carts started. |
| Breakdown | How one event splits by a property or attribute, as ranked bars. | Orders placed by city. |
| Retention | How many people come back after their first time. | Of people who first opened the app each week, how many opened it again? |
Before you start
- You need permission to view analytics to open reports and to run analysis. Saving a report needs the manage permission. Without it, Run and Save are disabled and a tooltip says why.
- Events must be flowing from your app or an import. If a report finds nothing it says so.
Open the reports list
- In the sidebar, open Reports & Alerts, then Reports.
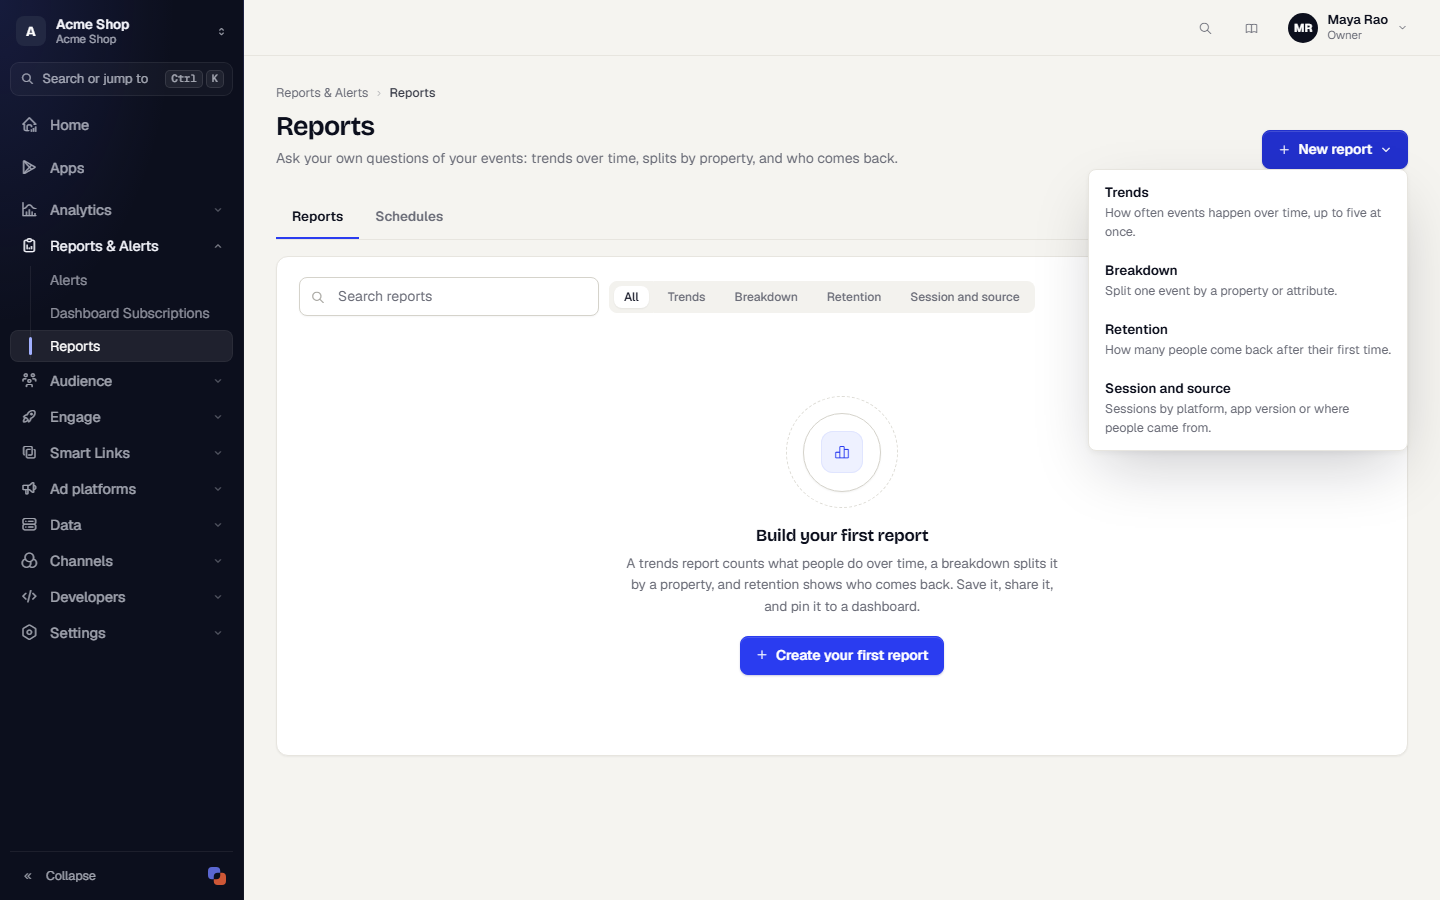
- Search by name, or narrow the list with All, Trends, Breakdown or Retention.
- Click New report and choose a kind. Each choice has a one-line description.
The page has three tabs, Reports, Campaign reports (if your role can view campaign reports) and Schedules. Campaign reports is described in Campaign reports. Schedules lists reports that are emailed on a repeating schedule. See Email a report on a schedule.
Settings every report shares
The builder has a Details card on the left and the results on the right.
- Name is required. Description is optional.
- Share with the workspace decides who can open the report. Off means Private.
- The date range (Last 7 days, Last 30 days, Last 90 days, Custom) and, for Trends and Breakdown, the granularity sit above the builder. Ranges are limited to 366 days. Retention starts at Last 30 days, because a cohort needs time to come back.
- Include imported history is off by default. Turn it on to count events you imported from a file.
- An optional Legend label names a series on the chart.
Build a Trends report
- On the reports list, click New report, then Trends.
- Under Series, choose an Event and a Measure:
- Total events: every time the event happened, including anonymous visitors.
- Unique users: each identified person once.
- Events per user: occurrences divided by the identified people who did it.
- Sum of a property, Average of a property, Minimum of a property, Maximum of a property: calculate a numeric property such as an order amount. Pick the Property. If a property isn't typed in your event dictionary it is flagged Not typed, and values that aren't numbers are skipped. The result says how many.
- Optionally add Only count when conditions to narrow the events.
- Click Add series to compare up to five events or measures on one chart.
- Under Break down, optionally pick a property in By to split a single series into lines. Choose how many Values shown (2 to 8). The rest are grouped as Other. With several series there is no breakdown.
- Under Display, choose Line or Bars. Turn on Compare to the previous period to draw the same number of buckets just before the range, dashed, in the same colour.
- Click Run.
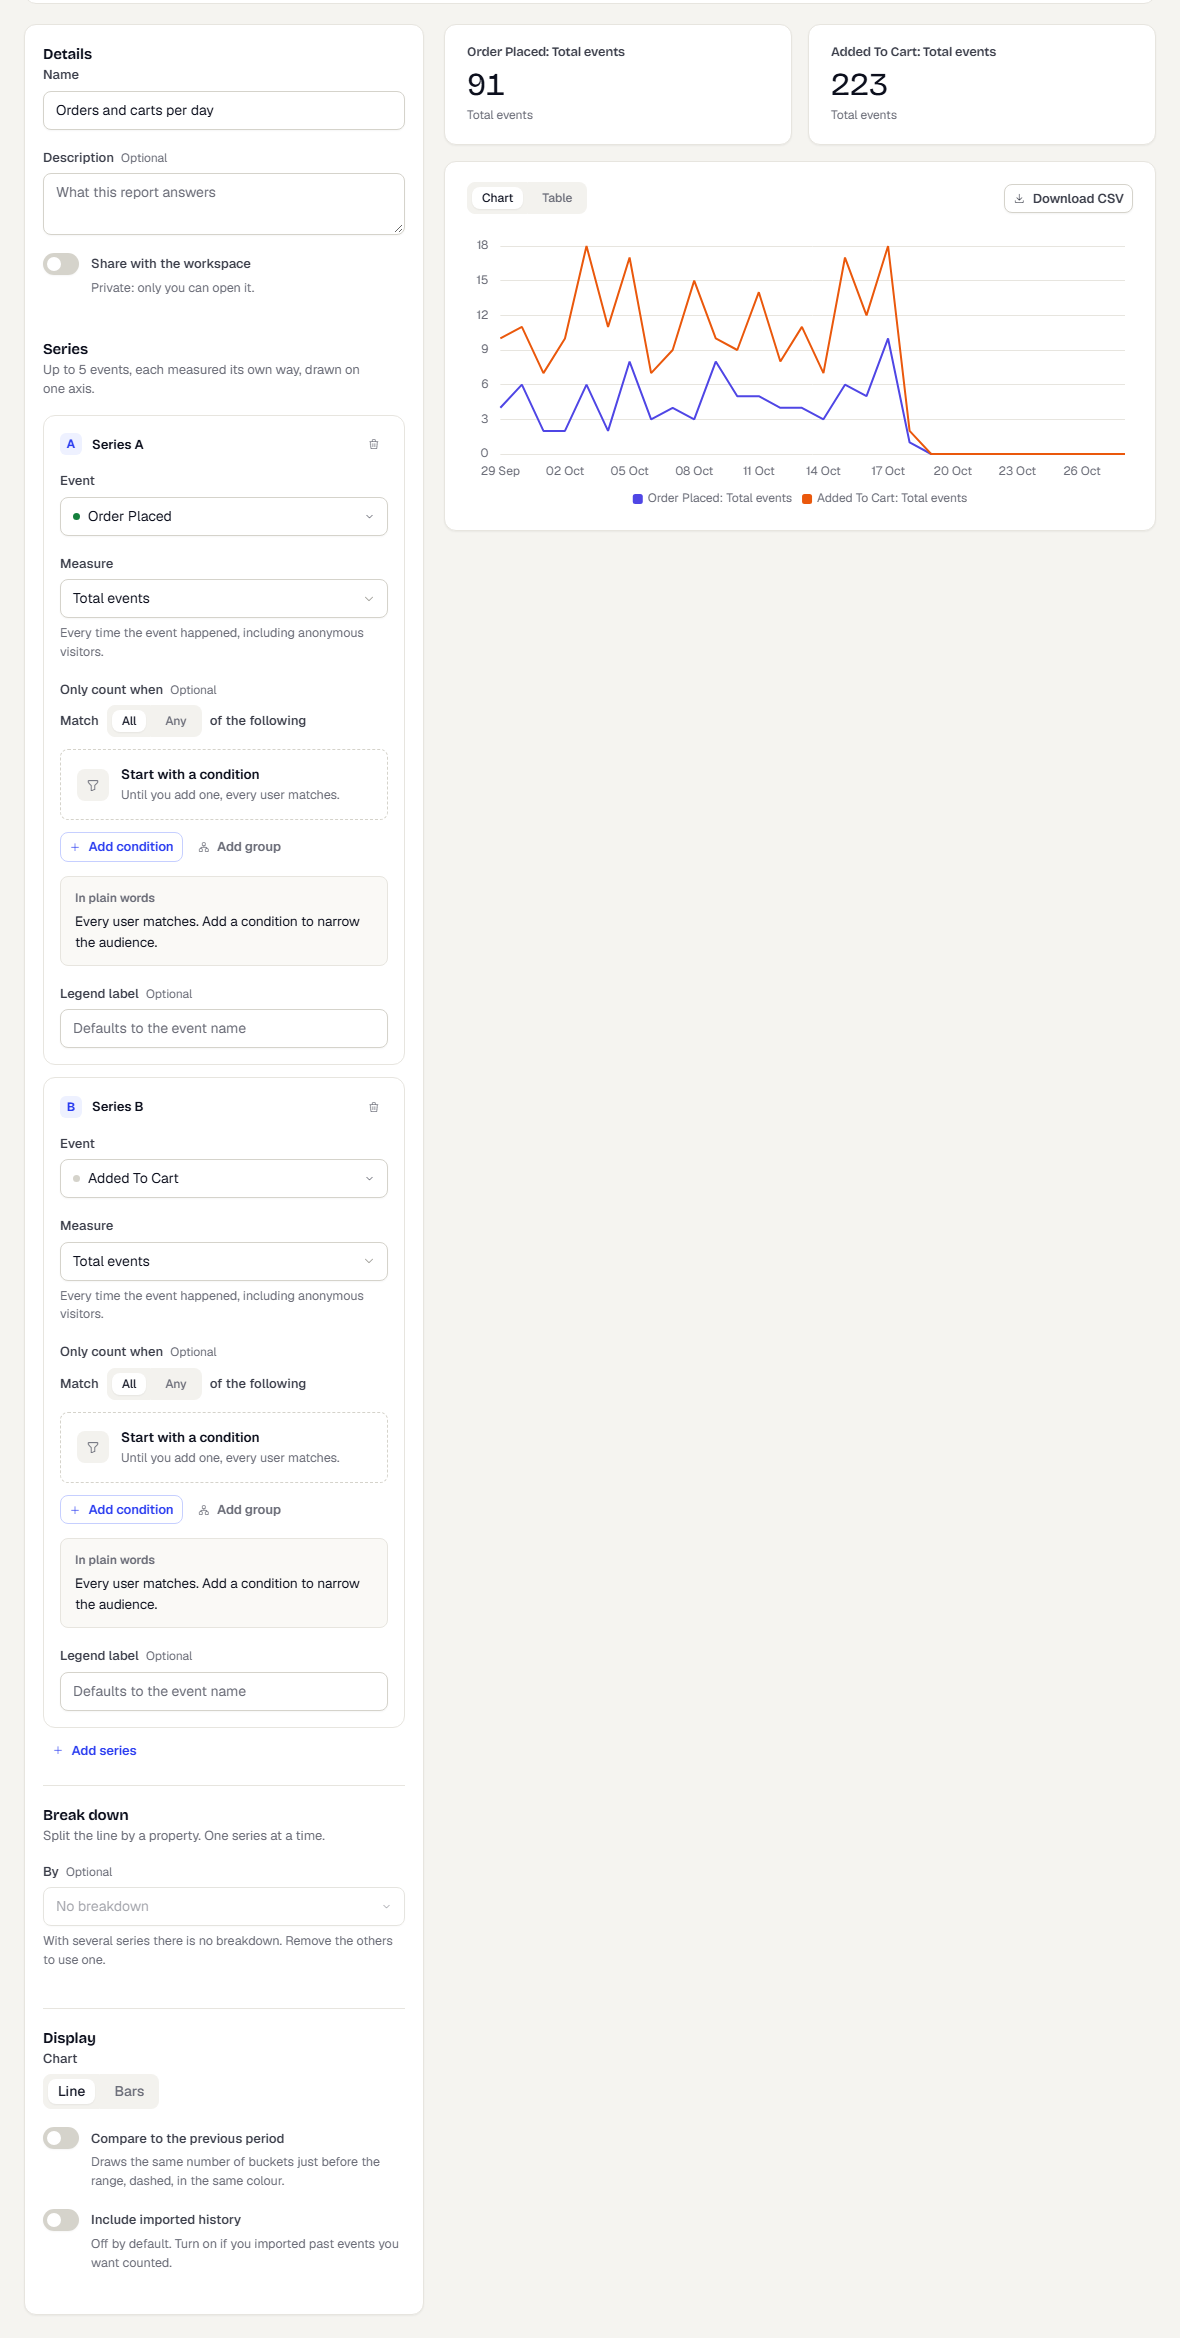
The results show a summary tile for each series, then a Chart you can switch to a Table. Click Download CSV to save the numbers.
Build a Breakdown report
- Click New report, then Breakdown.
- Under What to measure, choose one Event and a Measure, as in Trends.
- Under Split by, choose a Property (an event property or a user attribute) and the number of Values shown (1 to 50). Values outside the top few are grouped as Other. Attributes that hold personal data, such as birth date, can't be used as a breakdown.
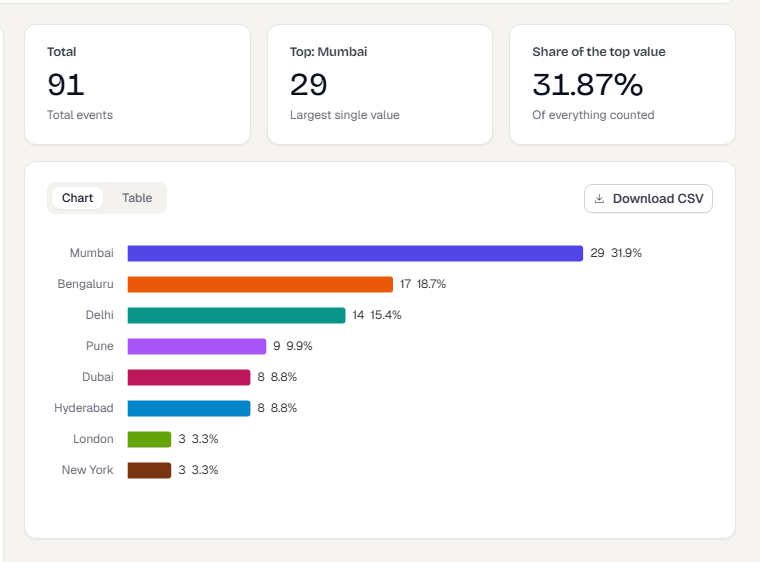
- Click Run. You get ranked bars, largest first, and a table.
Build a Retention report
- Click New report, then Retention.
- Under Who and what counts, choose the Start event. The first time someone does it puts them in a cohort. Choose Any activity to start from any real activity in the app.
- Choose the Return event. Coming back means doing this again.
- Under Periods, choose a Unit: Day, Week or Month. The date range above is the span of cohort start dates.
- Choose how to Count a return:
- Exact: the share who came back during exactly period N.
- Or later: the share who came back in period N or any later period. It can only go down.
- Brackets: the share who came back at least once inside each range you define. Pick a preset (Standard, one bracket per period such as First week, daily, or Long tail), or edit the From and To values and click Add bracket.
- Under Narrow down, optionally limit the cohorts to Only people in a segment, or split them with Break down by. With Any activity as the start, only user attributes are available for the breakdown.
- Click Run.
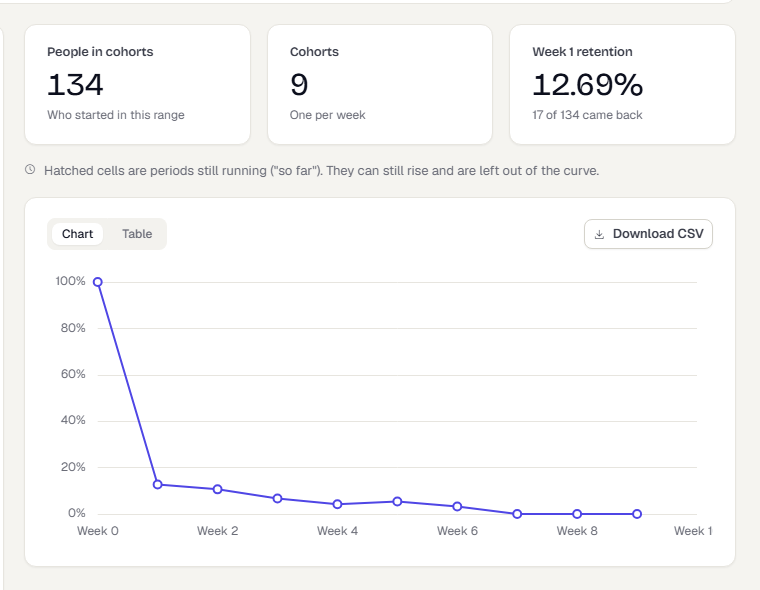
Summary tiles show People in cohorts, Cohorts and the first-period retention. The Chart shows the retention curve. Switch to Table for the cohort grid: each row is a cohort, each column a period. Hatched cells are periods still running. They can still rise and are left out of the curve.
Save the people from a cell
Click a cell in the grid. A bar appears with Save who came back and Save who did not. Each opens a dialog that saves a static segment of those people. The segment doesn't update later. This needs permission to create segments.
Build a Session and source report
Use this report to see how many sessions your app or site has, and where the people behind them came from.
- Choose Session and source when you create a report.
- Pick a Metric.
- Optionally add up to two Source property splits. Choose First touch or Last touch when you split by an acquisition property.
- Optionally add filters (platform, app version, first or returning sessions) or restrict to a segment.
- Choose the date range and select Apply.
| Metric | What it counts | What it does not |
|---|---|---|
| Sessions | Sessions in the range. A session ends after 30 minutes of no activity. | |
| Unique users | Different people with a session in the range, counted once. | It is not the sum of the daily figures. |
| New-user sessions | Sessions that were a person's first. | |
| Bounce rate | Sessions with one screen view or fewer, as a share of all sessions. | Not a web bounce definition. |
| Average active span | The average time between a session's first and last action. | It is not time on screen or time spent. A session with one action has a span of zero. |
| Sessions per user | Sessions divided by different people. |
Splits by Platform, App version and First session or returning describe the session. Splits by UTM source, UTM medium, UTM campaign, Media source, Ad platform and Touch channel describe the person: where they first (or last) came from, applied to each of their sessions. They do not tell you the channel of that particular session. People with no recorded source appear as (not set).
Groups beyond your Rows shown limit are combined into Other. Imported history cannot be told apart from live sessions here, so there is no imported-history option.
Save the report
- Click Save. The report is saved and opens in view mode.
- To keep the original and save a variation, click Save as while editing. Name the copy and click Save copy. The copy is private.
- If the definition or the dates changed since the last run, a yellow note says so. Click Run to refresh the results.
In view mode you can click Recompute to refresh the numbers, Duplicate to copy the report, and Edit to change it. Only the creator or the workspace owner can edit.
If someone else saves the report while you are editing it, your save isn't applied. The page says Someone else saved this report while you were editing, so your save was not applied. Click Reload to see their version.
Add a report to a dashboard
Saved reports can be tiles on a custom dashboard. Use the Reports tab in Add a widget.
What happens next
Reports run on demand. Large ranges can take longer, and the page says when it is running. Report definitions are saved, and results are recomputed when you press Run or Recompute.
Related
Was this page helpful?